Table of Contents
AWS Integration tutorial
Introduction
Data can be transferred to Amazon Web Services IoT Core in a number of ways, but in this guide, we’ll focus on sending data in JSON format via Message Queuing Telemetry Transport (MQTT), which is an efficient publish-subscribe-based messaging protocol optimised for high-latency, low-bandwidth networks connections.
More about MQTT on WebHMI here
Configure AWS IoT Core
 The AWS Management Console is a browser-based GUI for Amazon Web Services through which a customer can manage their cloud computing, cloud storage and other resources running on the Amazon Web Services infrastructure.
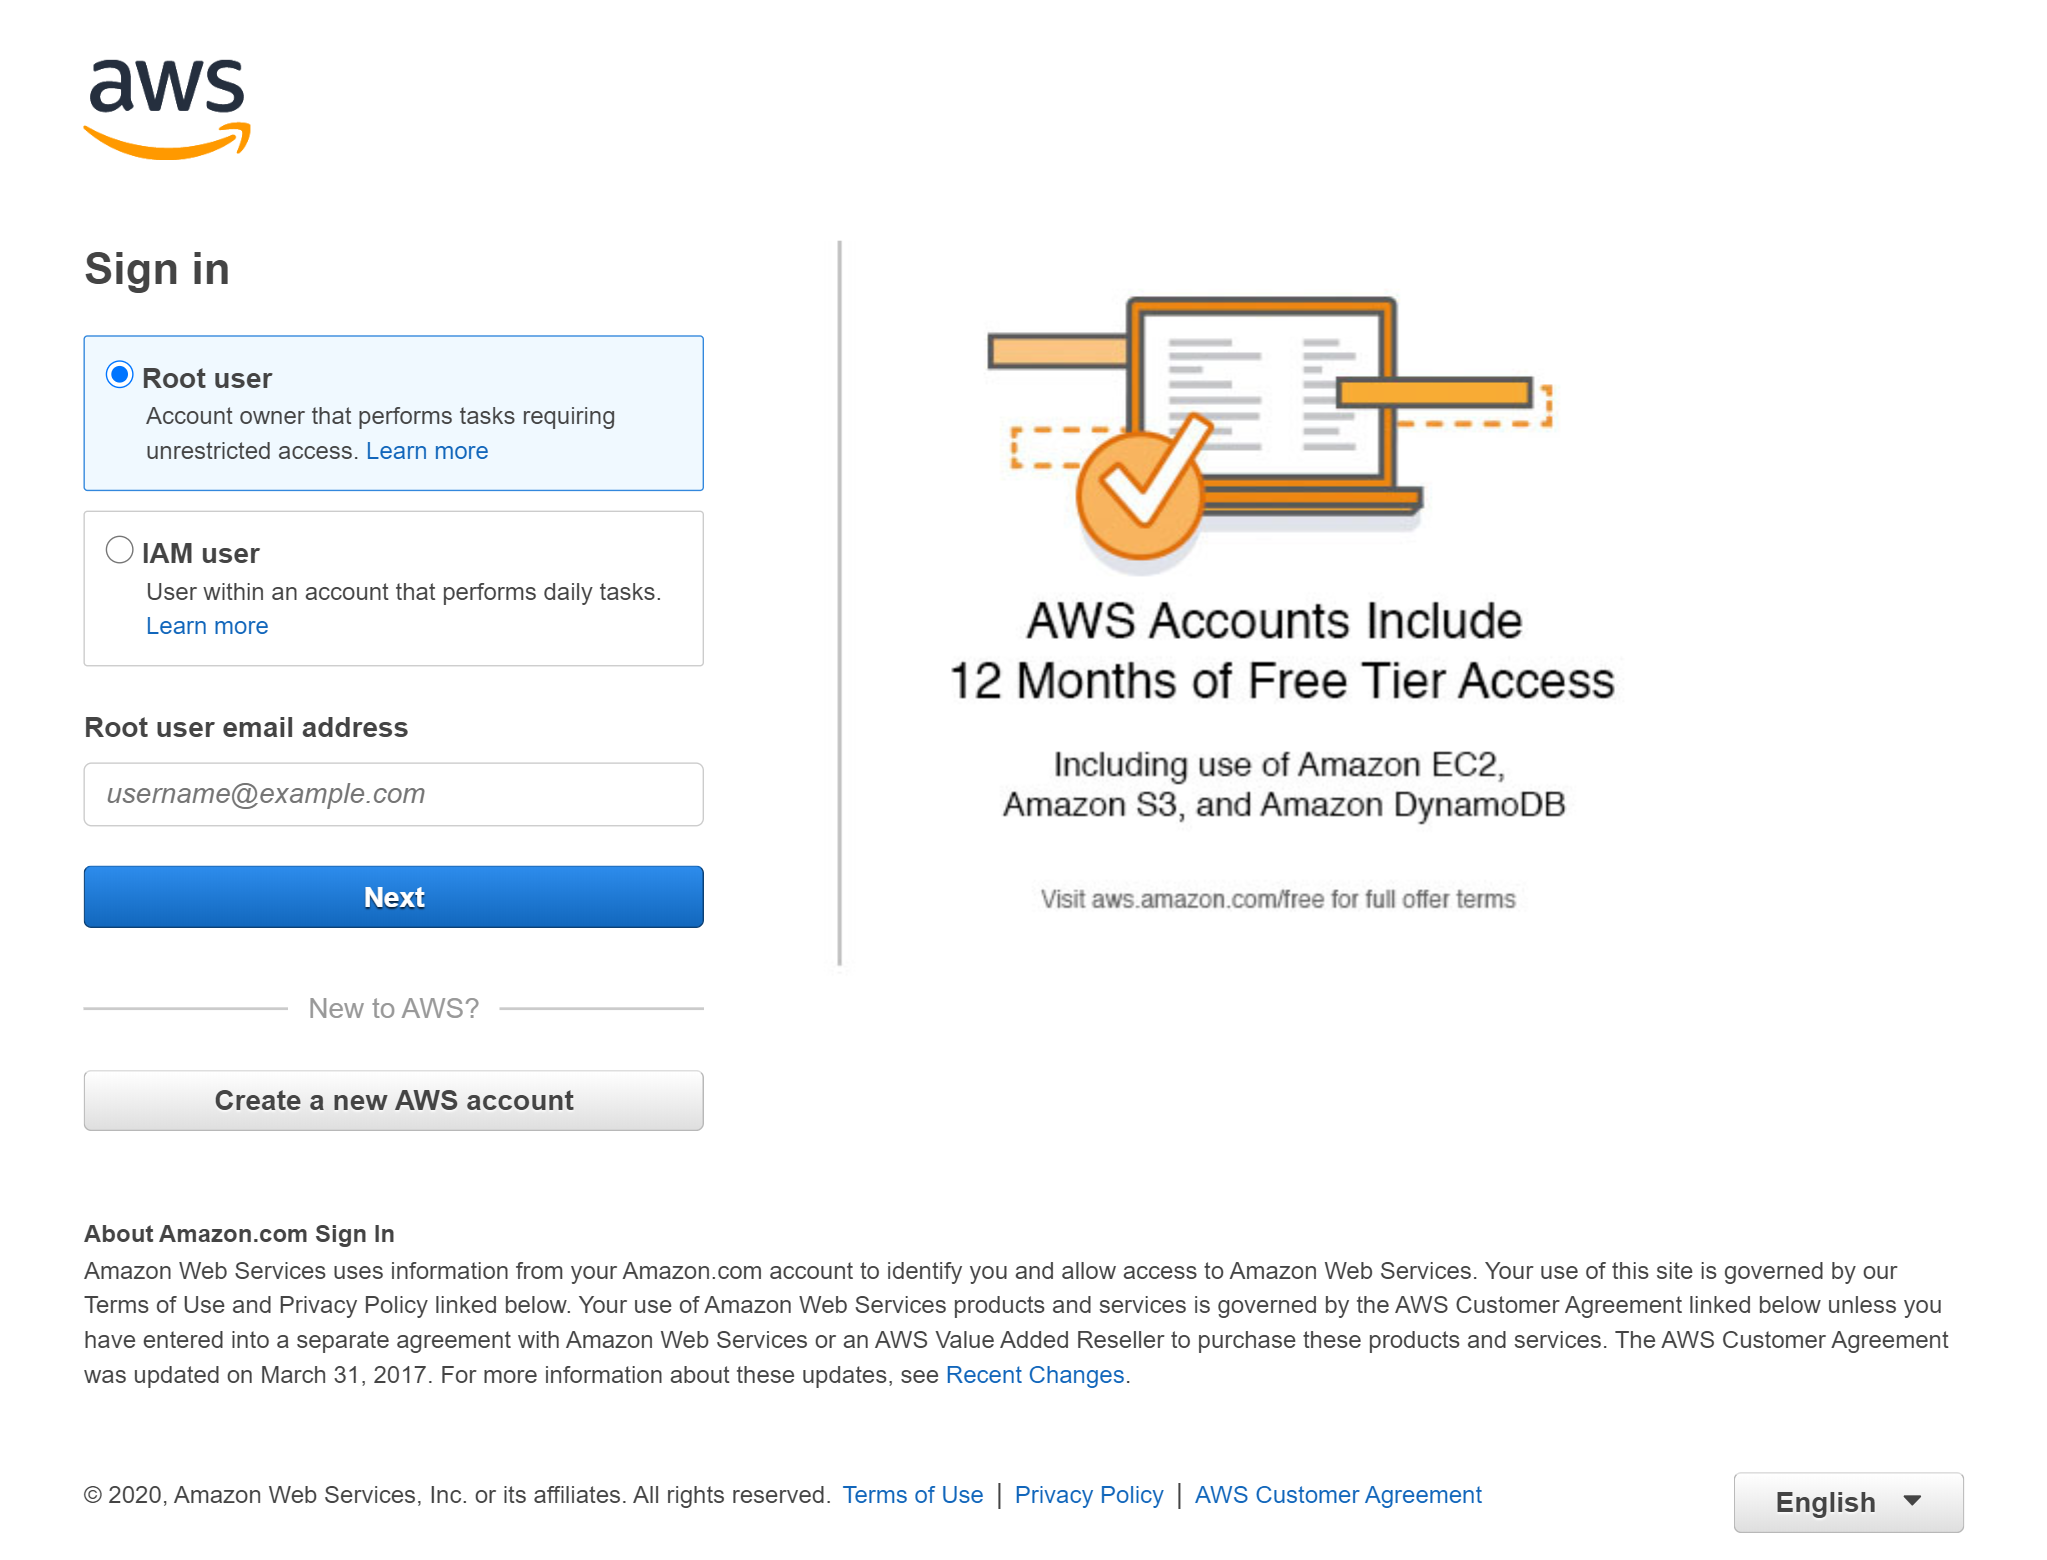
Log in to your AWS Console
To get started, sign up for an account on AWS or log in to your existing account at AWS Console.
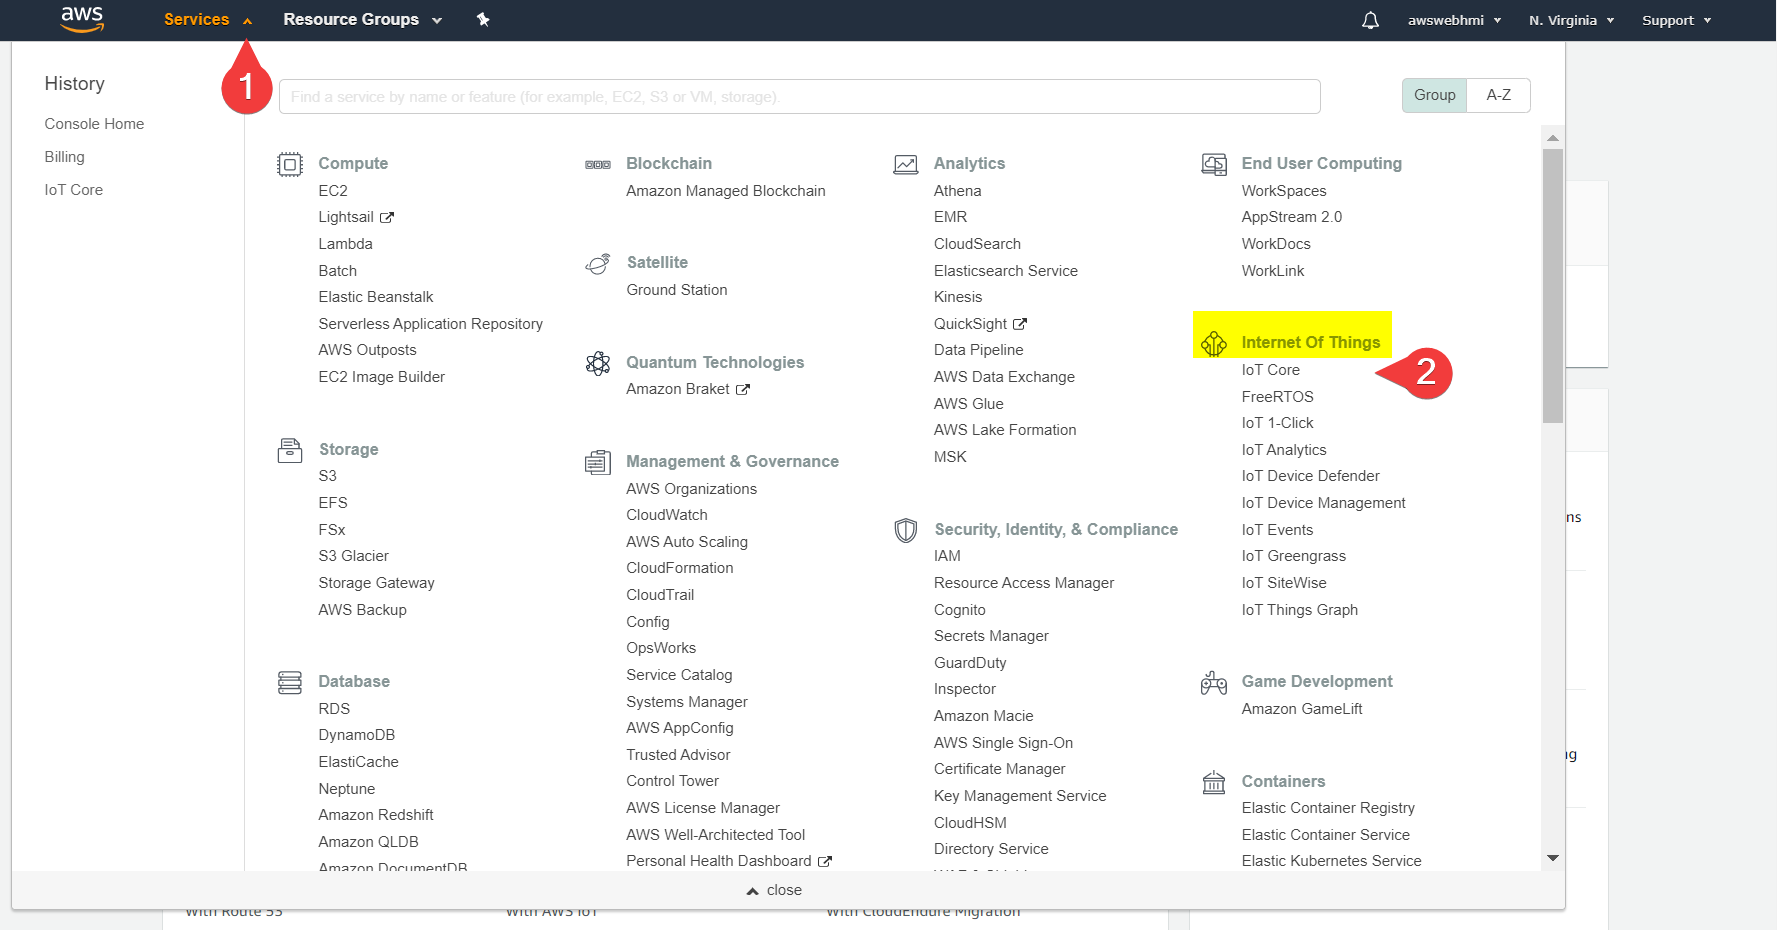
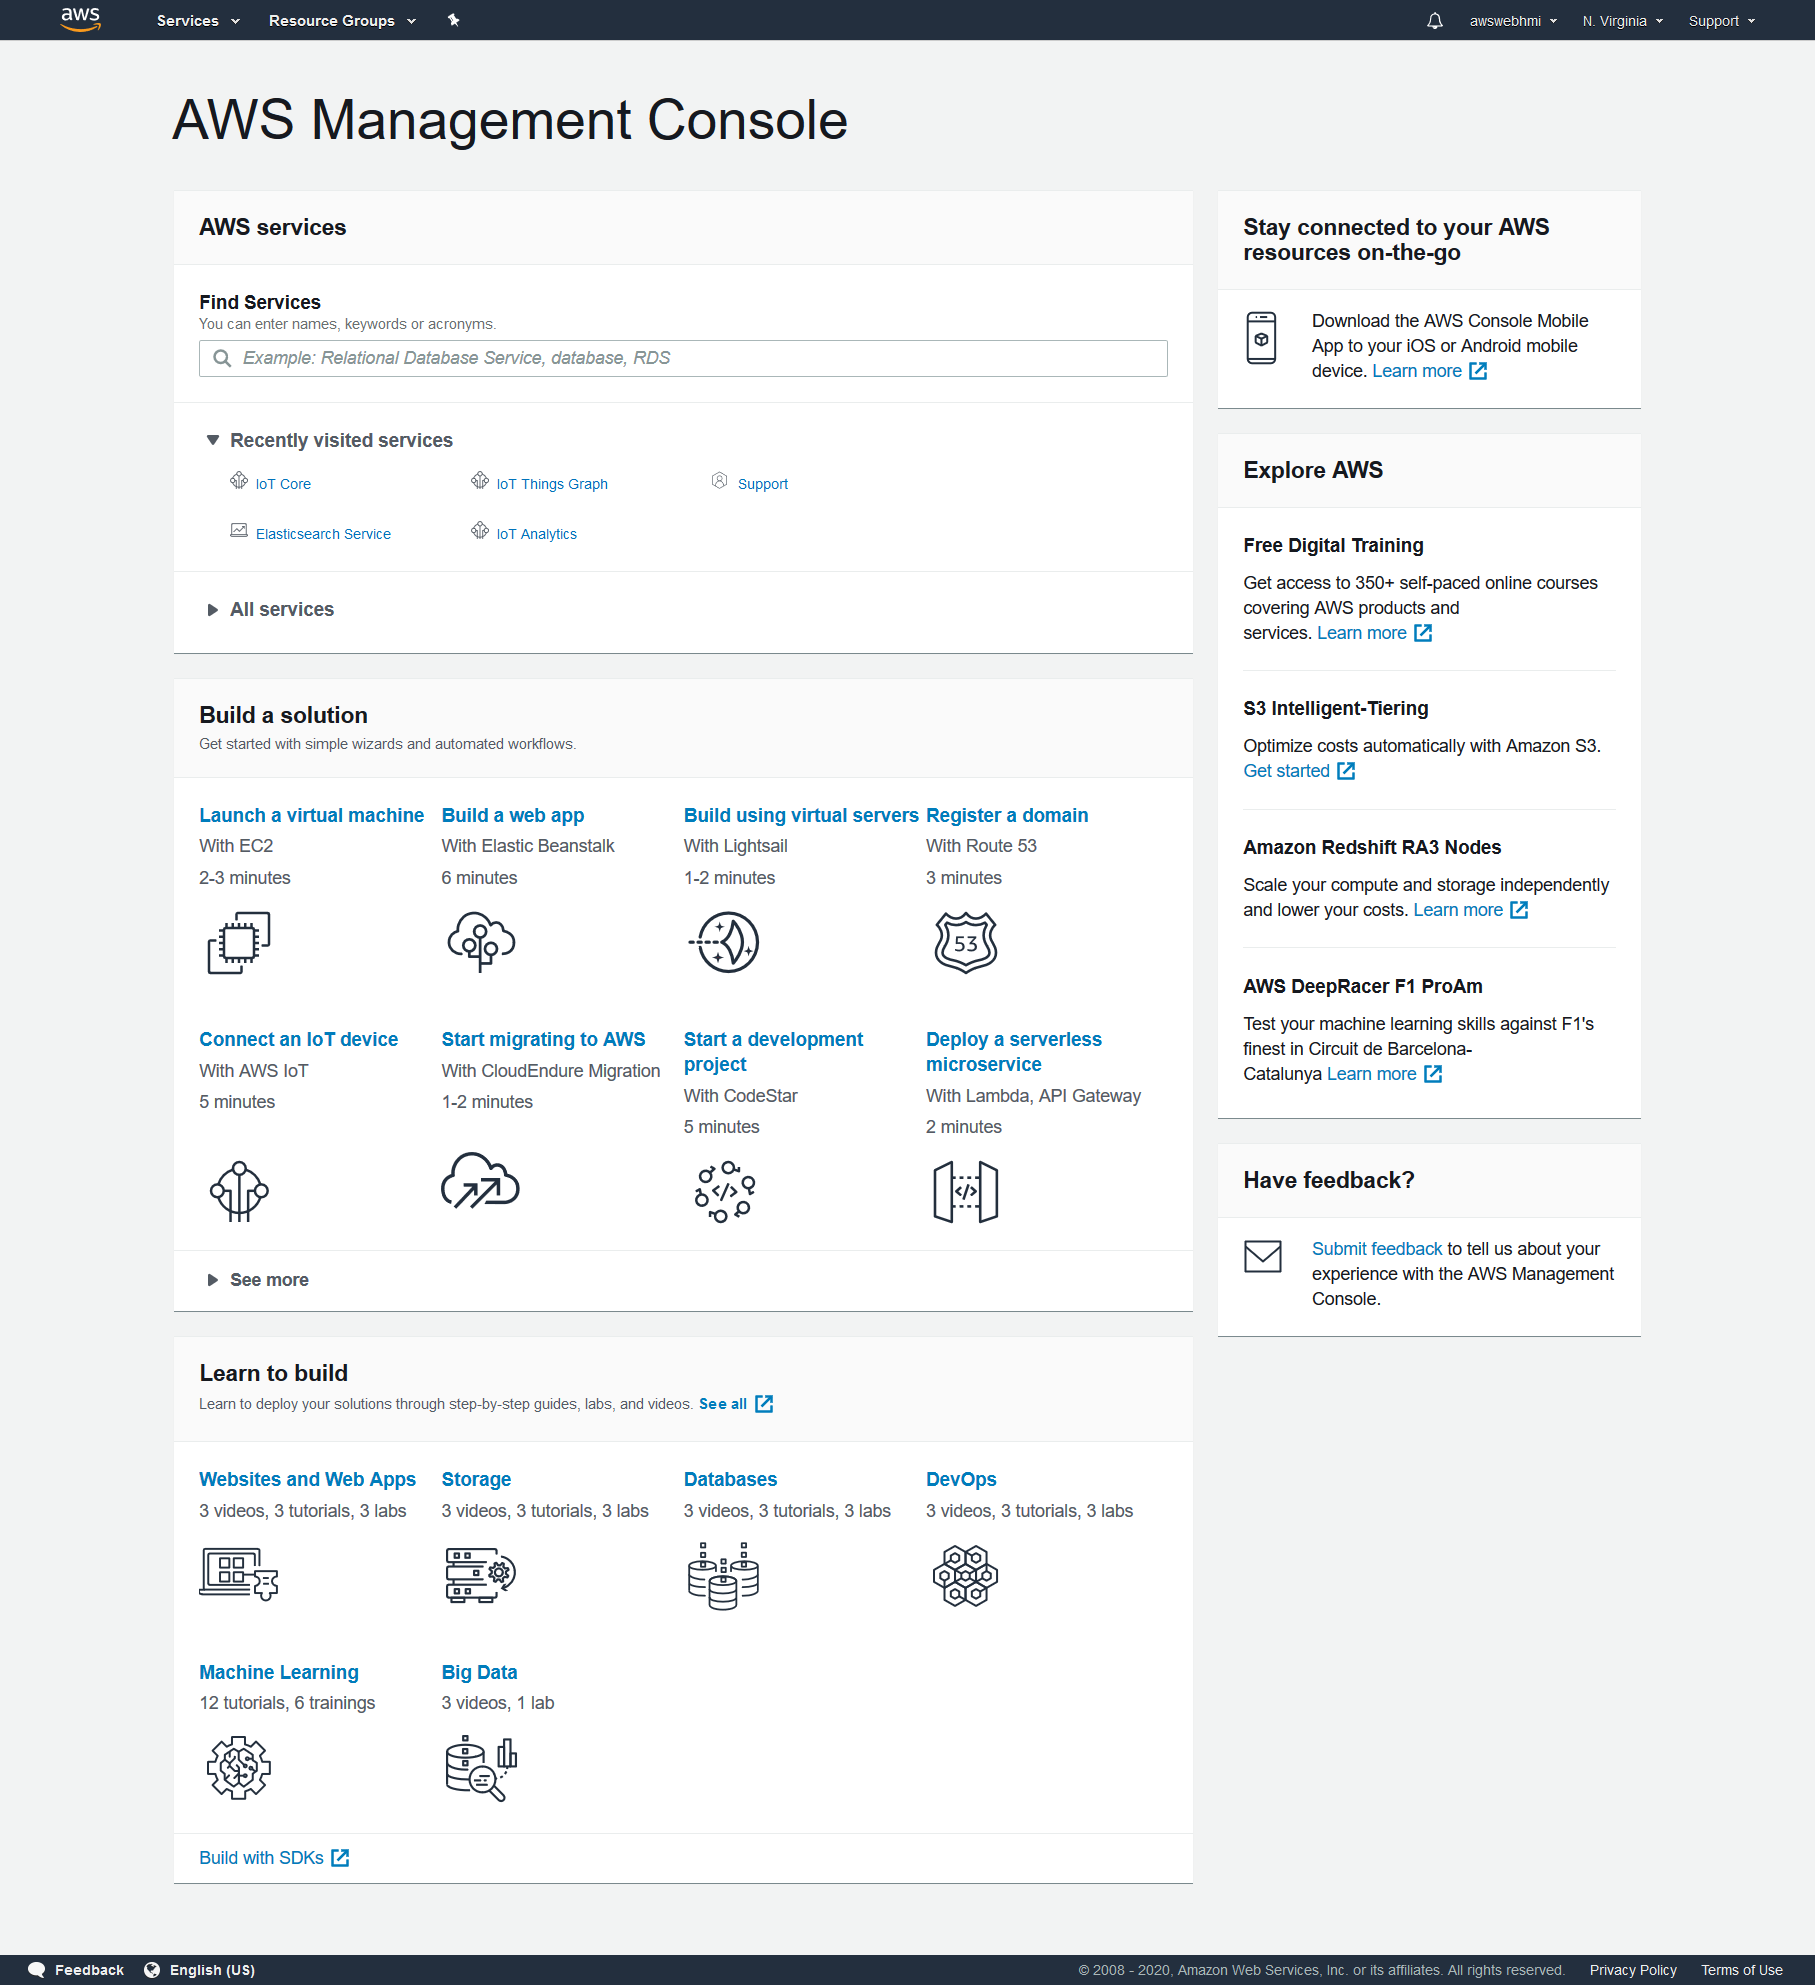 Then go to AWS IoT Core.
Create a new 'Thing'
AWS IoT Core refers to devices that connect to the platform as Things (as a unit of Internet of Things).
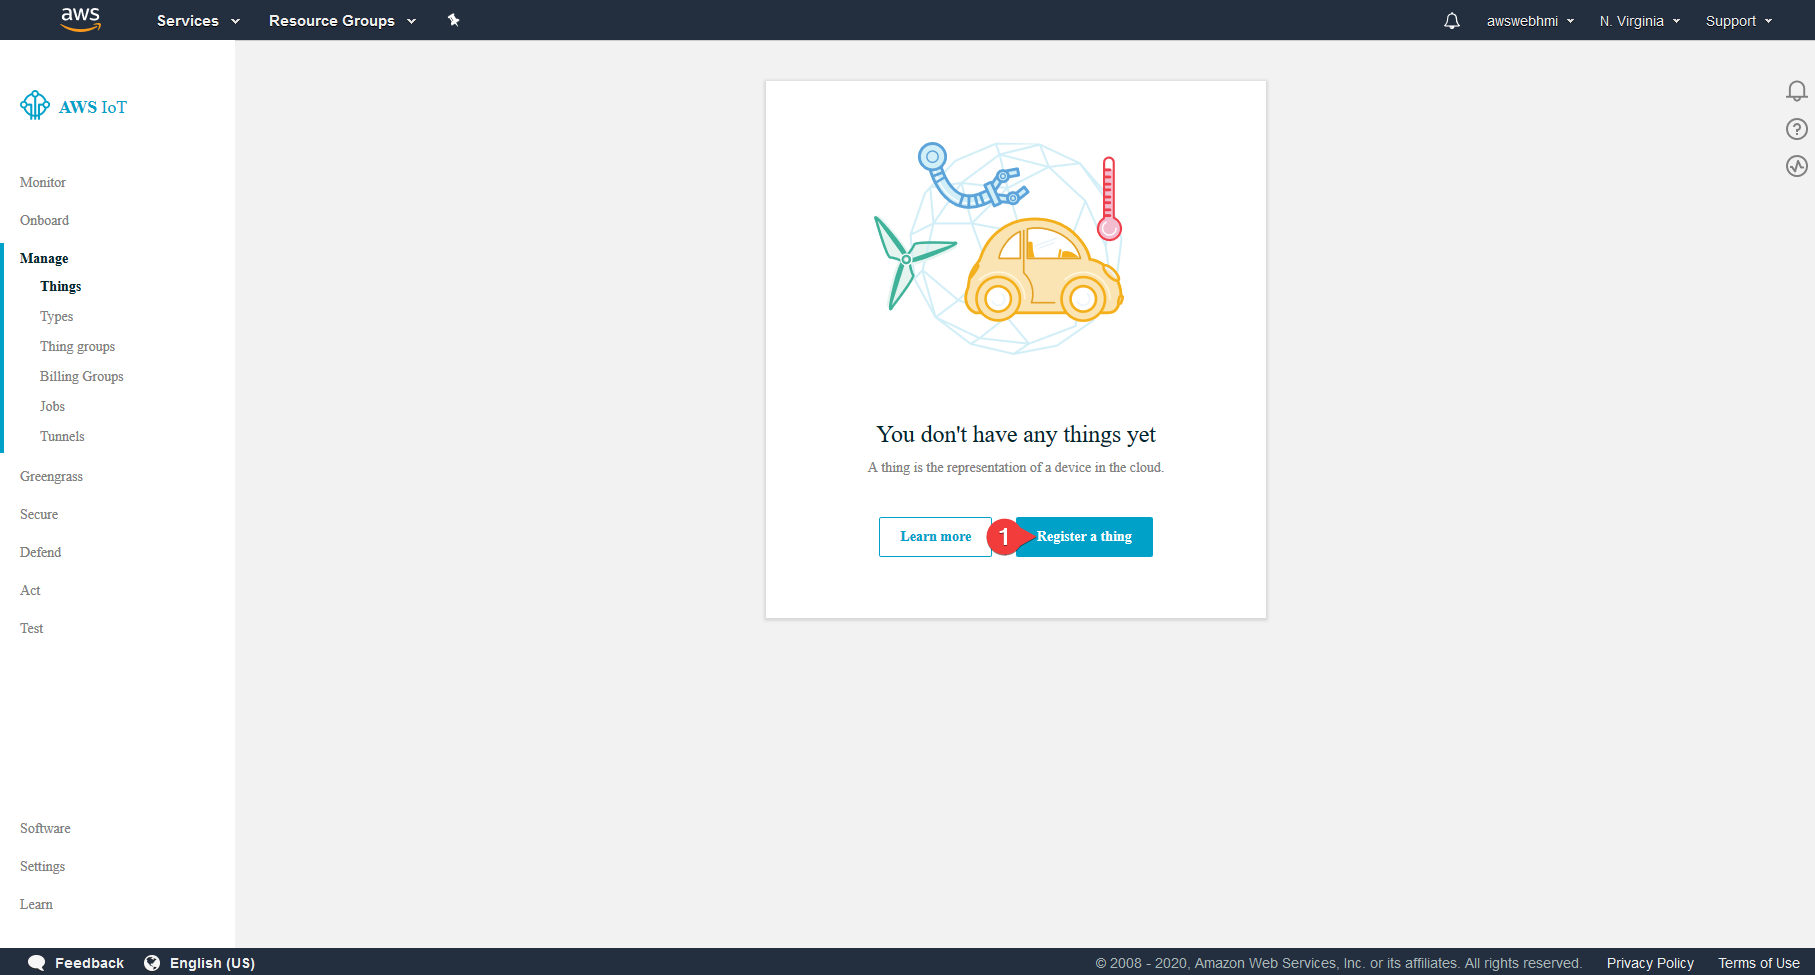
There is an AWS IoT Interactive Tutorial to create the first Thing. It is recommended not to skip it for the first time. But to improve the repeatability of the tutorial it would be skipped.
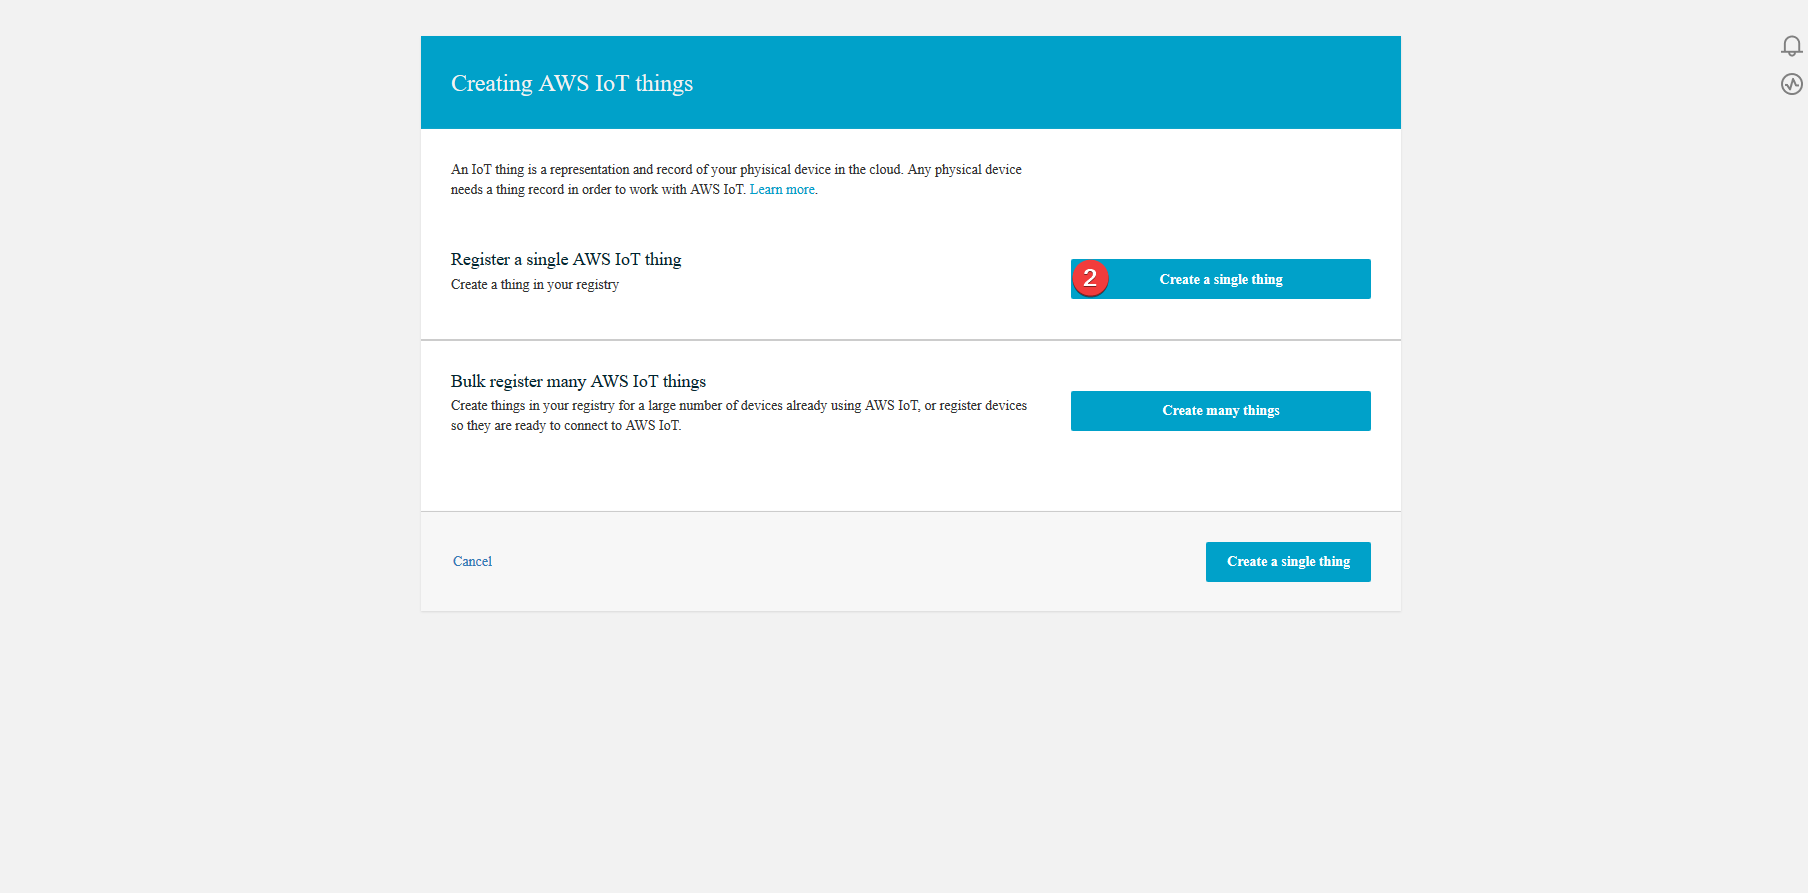
Go to Manage, Things submenu and let's create a new Thing.
 Pick the single Thing to be created.
 Fill in the required fields, such as Thing's name. Remember that the name can't be changed. But Tags inside that Thing can be edited.
 At the moment it would be convenient to create a Thing Type which is a template for new Things.
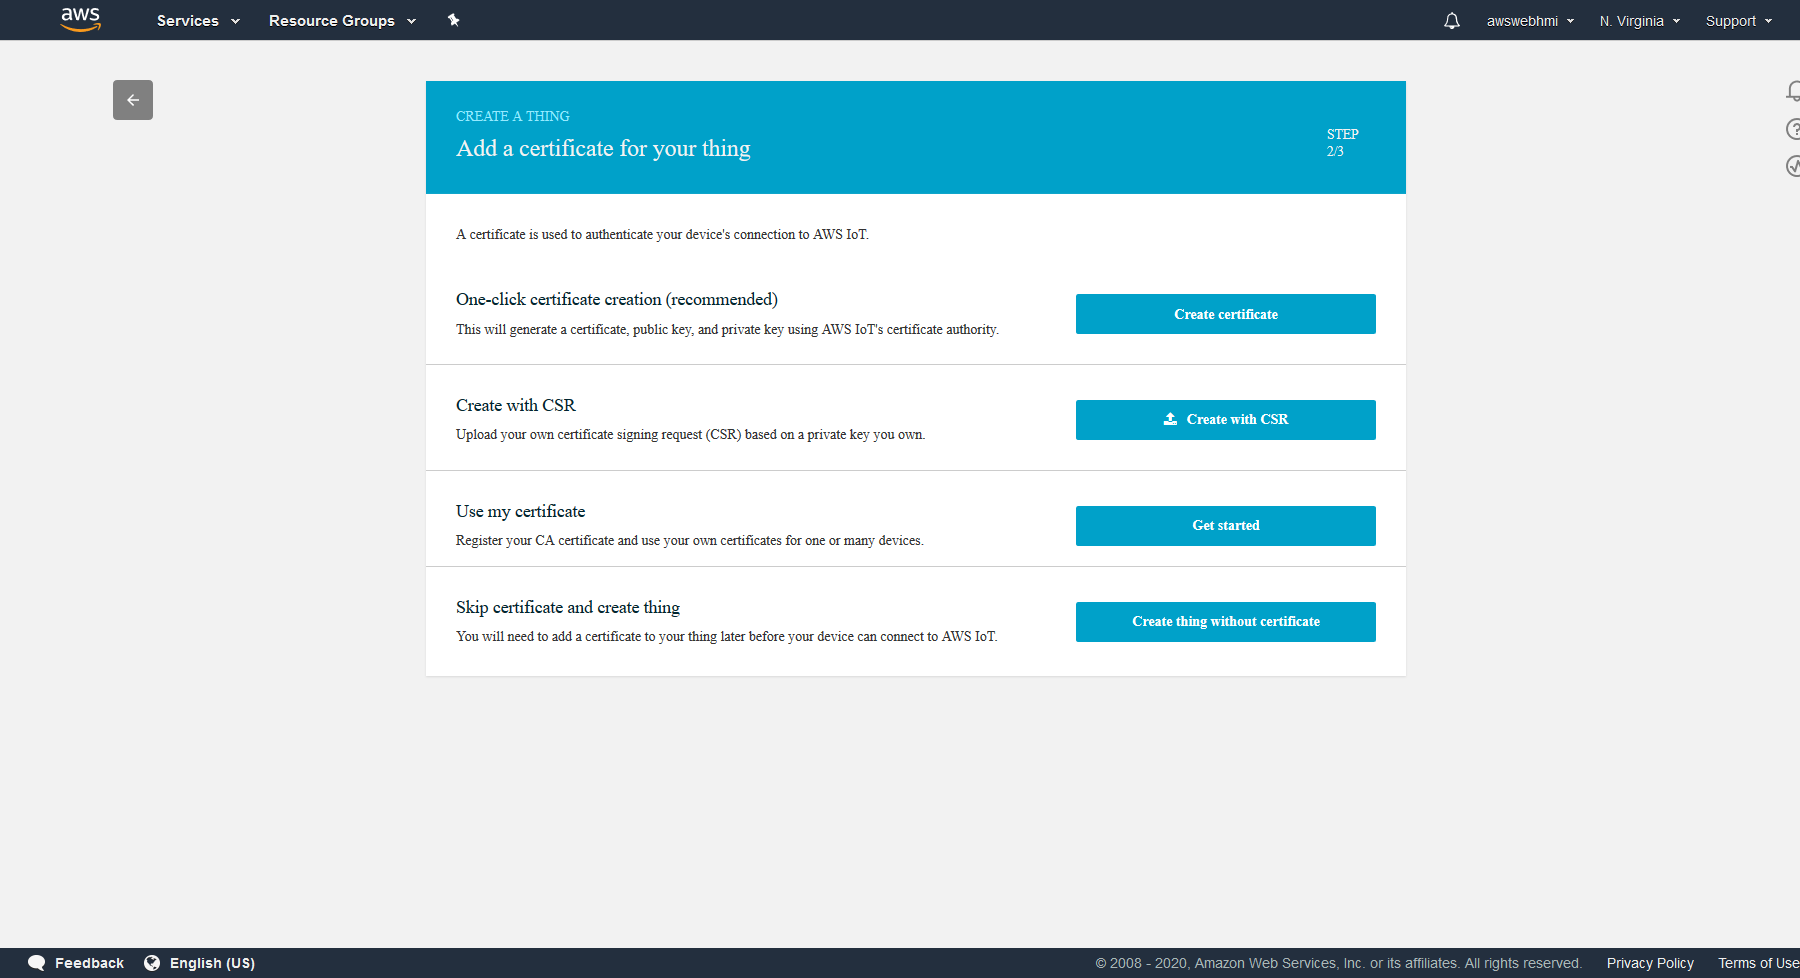
Select the “one-click certificate creation”.
 As a result you should see notifications in the top-right corner about successfully created certificates.
 Download and secure the following files.
Root CA selection and downloading will be shown later.
Download and secure the following files.
Root CA selection and downloading will be shown later.
Create a new Thing Type
To effectively create a bunch of 'Things' the best practice is to create a template. Such a template is a 'Thing Type'. It is also a good representation of real-world devices of the same model. You can also predefine a Tag for Thing, both in template and individual to simplify the search in the fleet of Things and also to understand which real device is bound to particular Thing, e.g. both S/N and location.
Create a Certificates
At the moment you should have .pem certificate with private and public keys generated and downloaded. Keep them secure.
The last piece of the certificates-puzzle is a Root CA certificate. To publish them or the possibility of its theft is risky due to possible unwanted payments. But that does not apply to Root CA certificate, because it is public already.
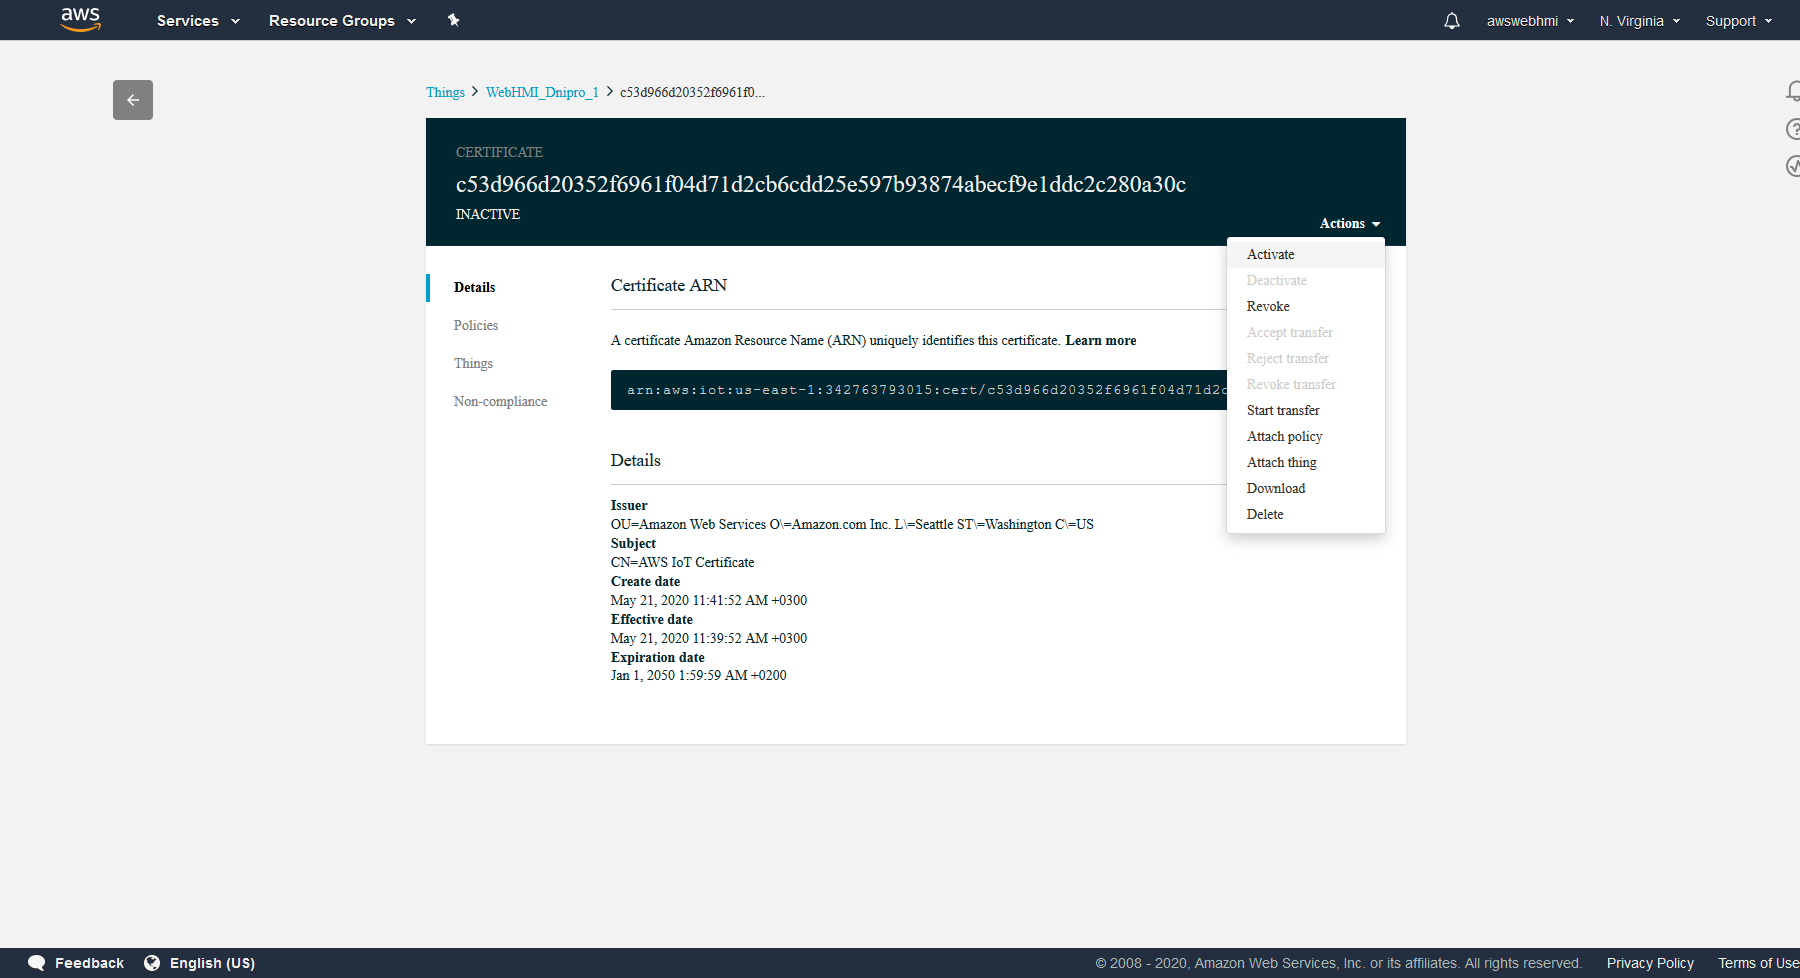
 The last step is to activate Thing's certificate in the IoT console, Manage menu entry, Things, select the Thing and go to Security, select linked certificate and click Actions in top right corner and click “Activate”.
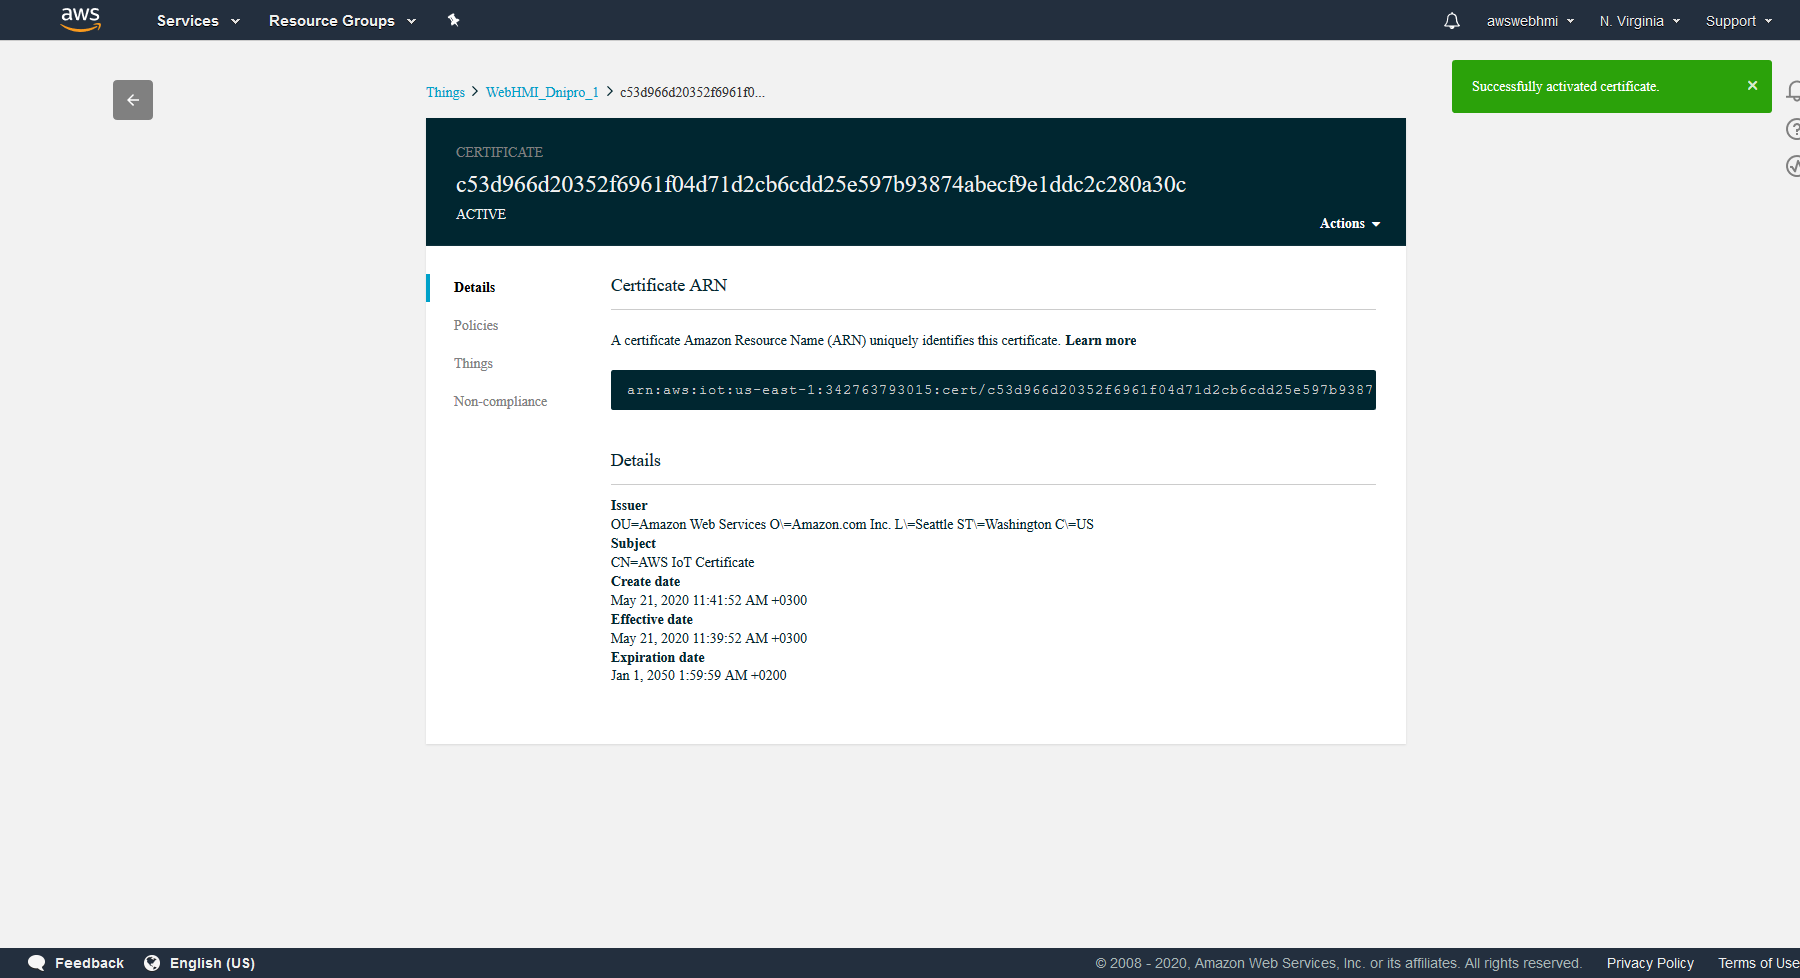
 The certificate status in the top left corner must change to “ACTIVE”.
Create a Policies
To establish connection it is policies should be configured.
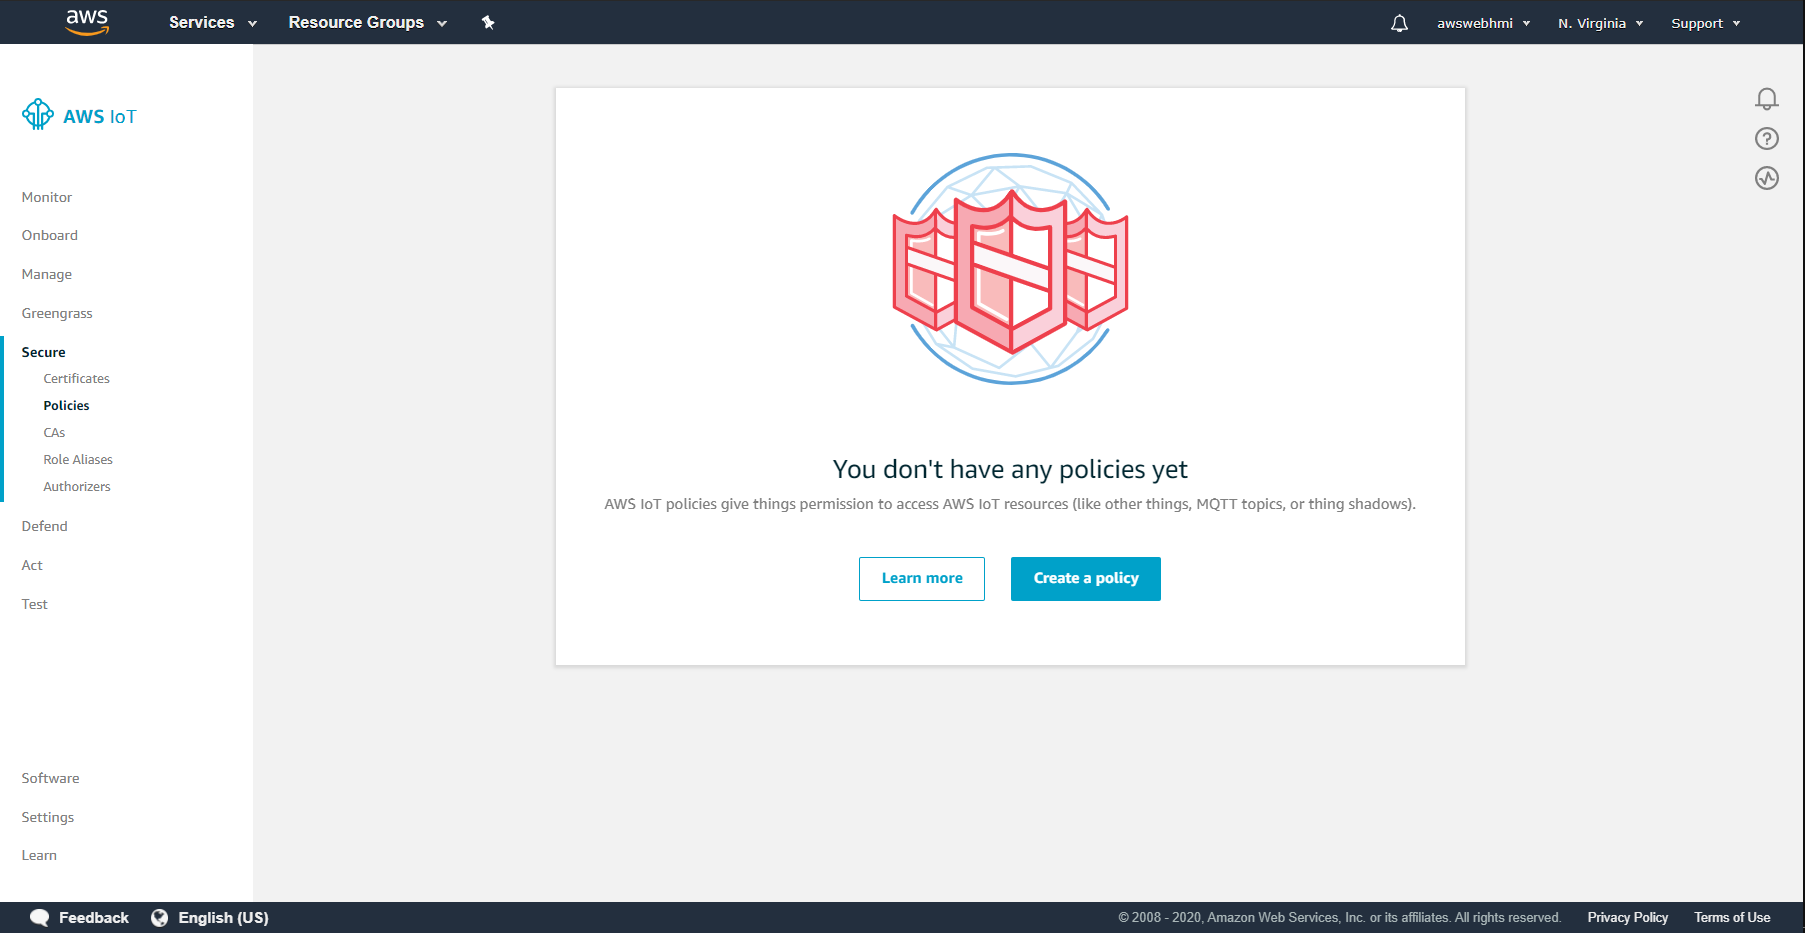
If there is no policies during Thing creation generated, let's do this manually.
 Go to IoT Core Manage, select your Thing, then Secure, Policies. Let's create a new one.
 Use the following setting to test connection. Wildcard symbol * represents all of availiable ARNs and subaction such as “iot:Publish”, “iot:Subcribe” etc.
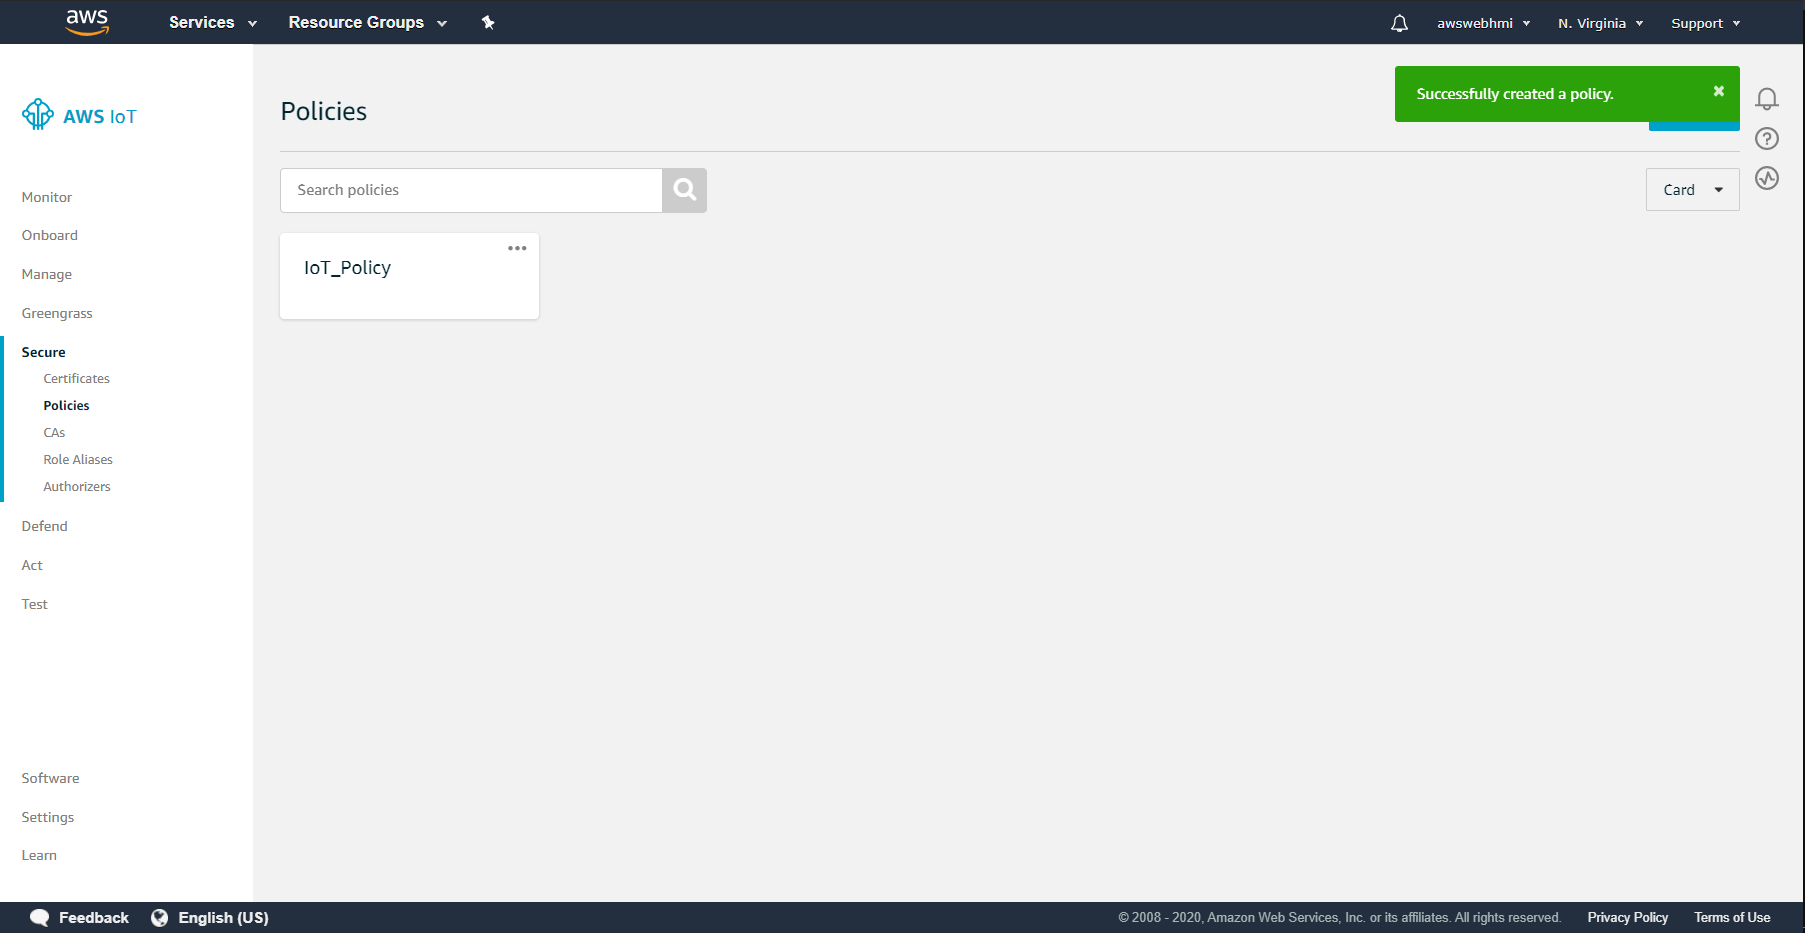
 So now it is created.
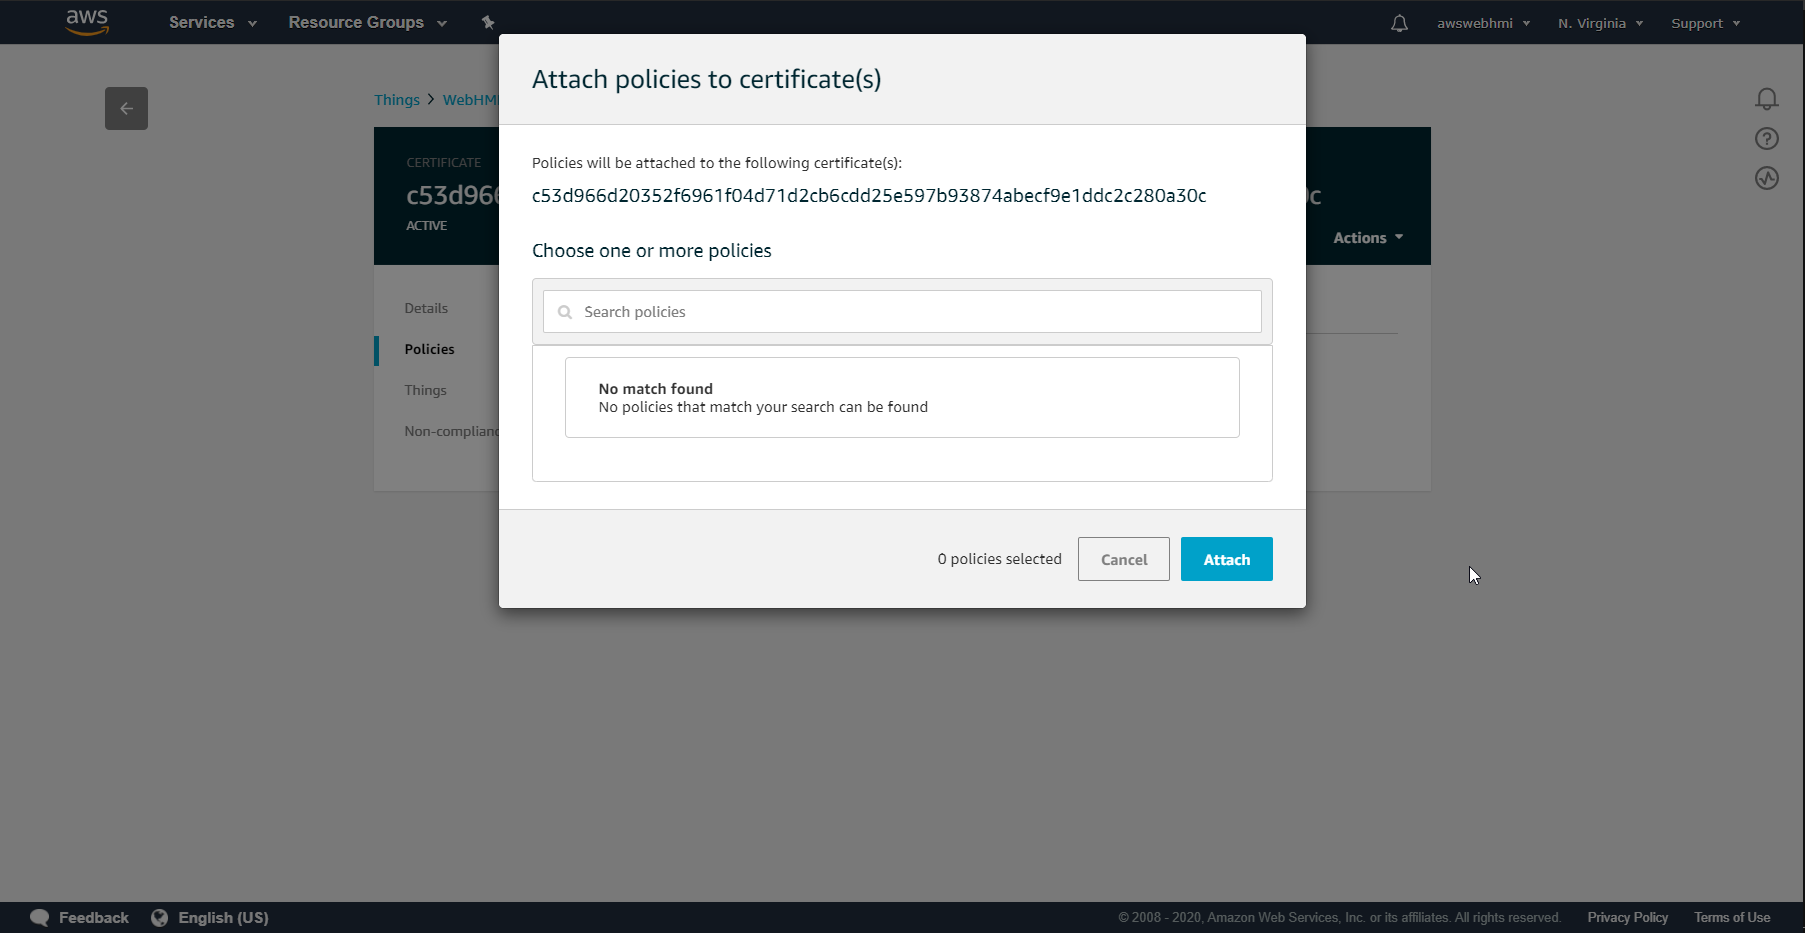
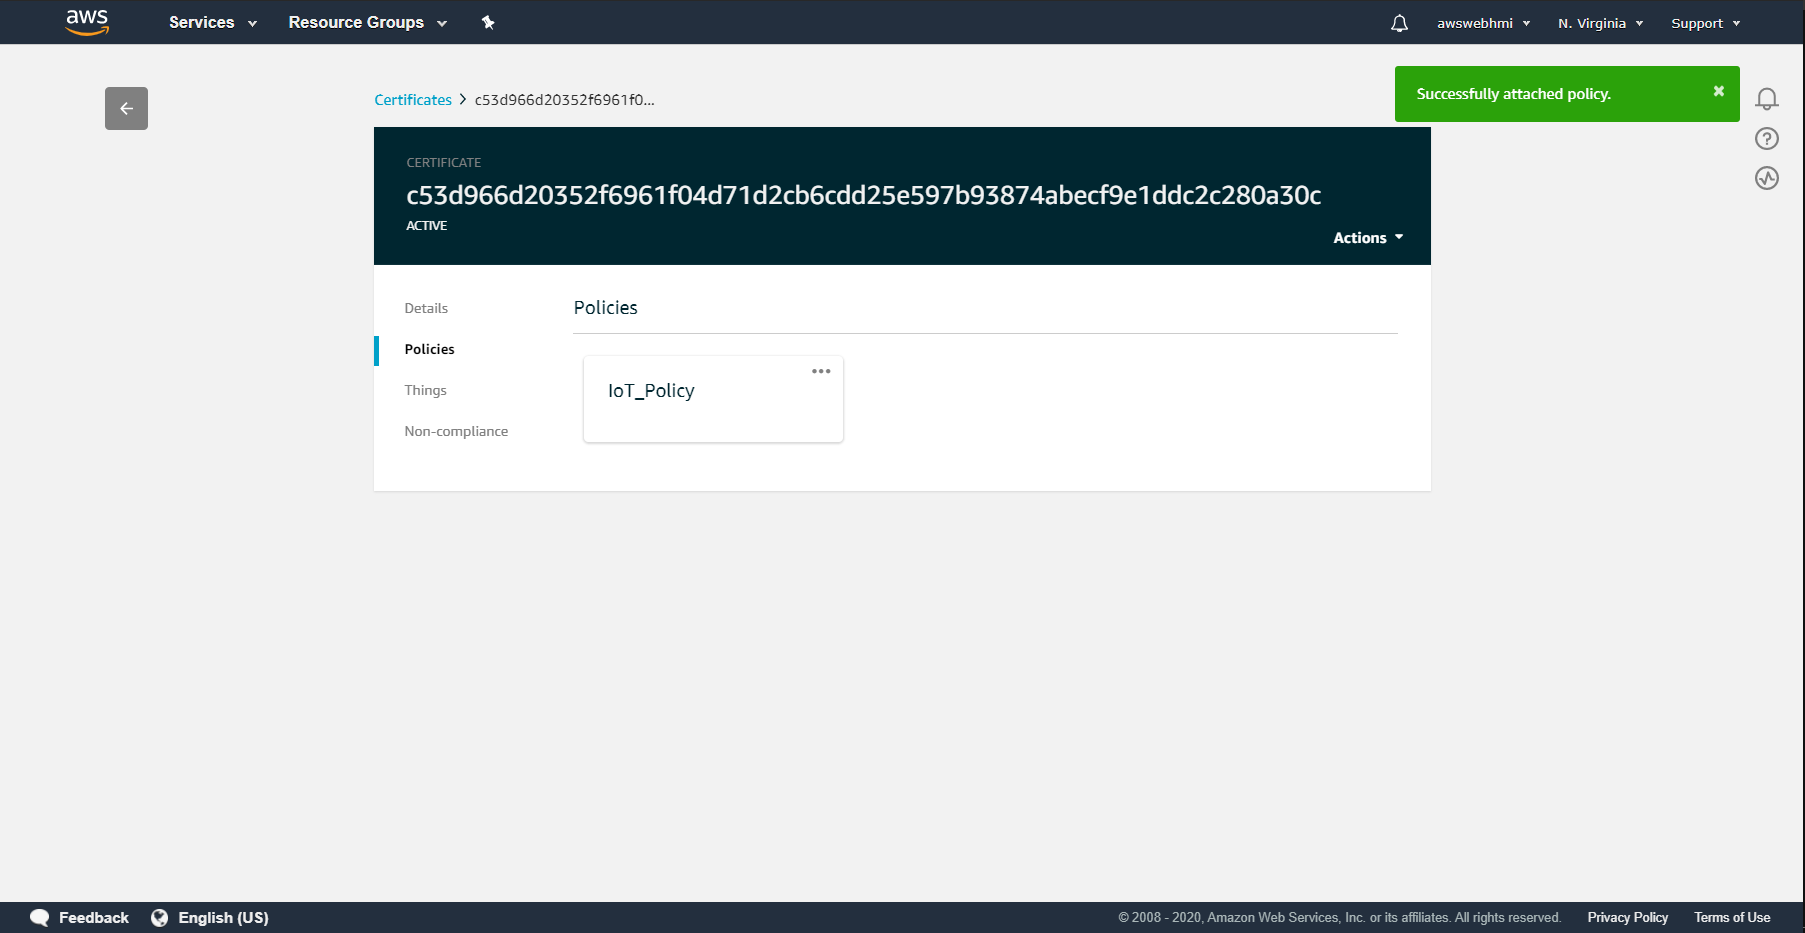
 So going back to Thing, Certificate, Policies and select the policy that created.
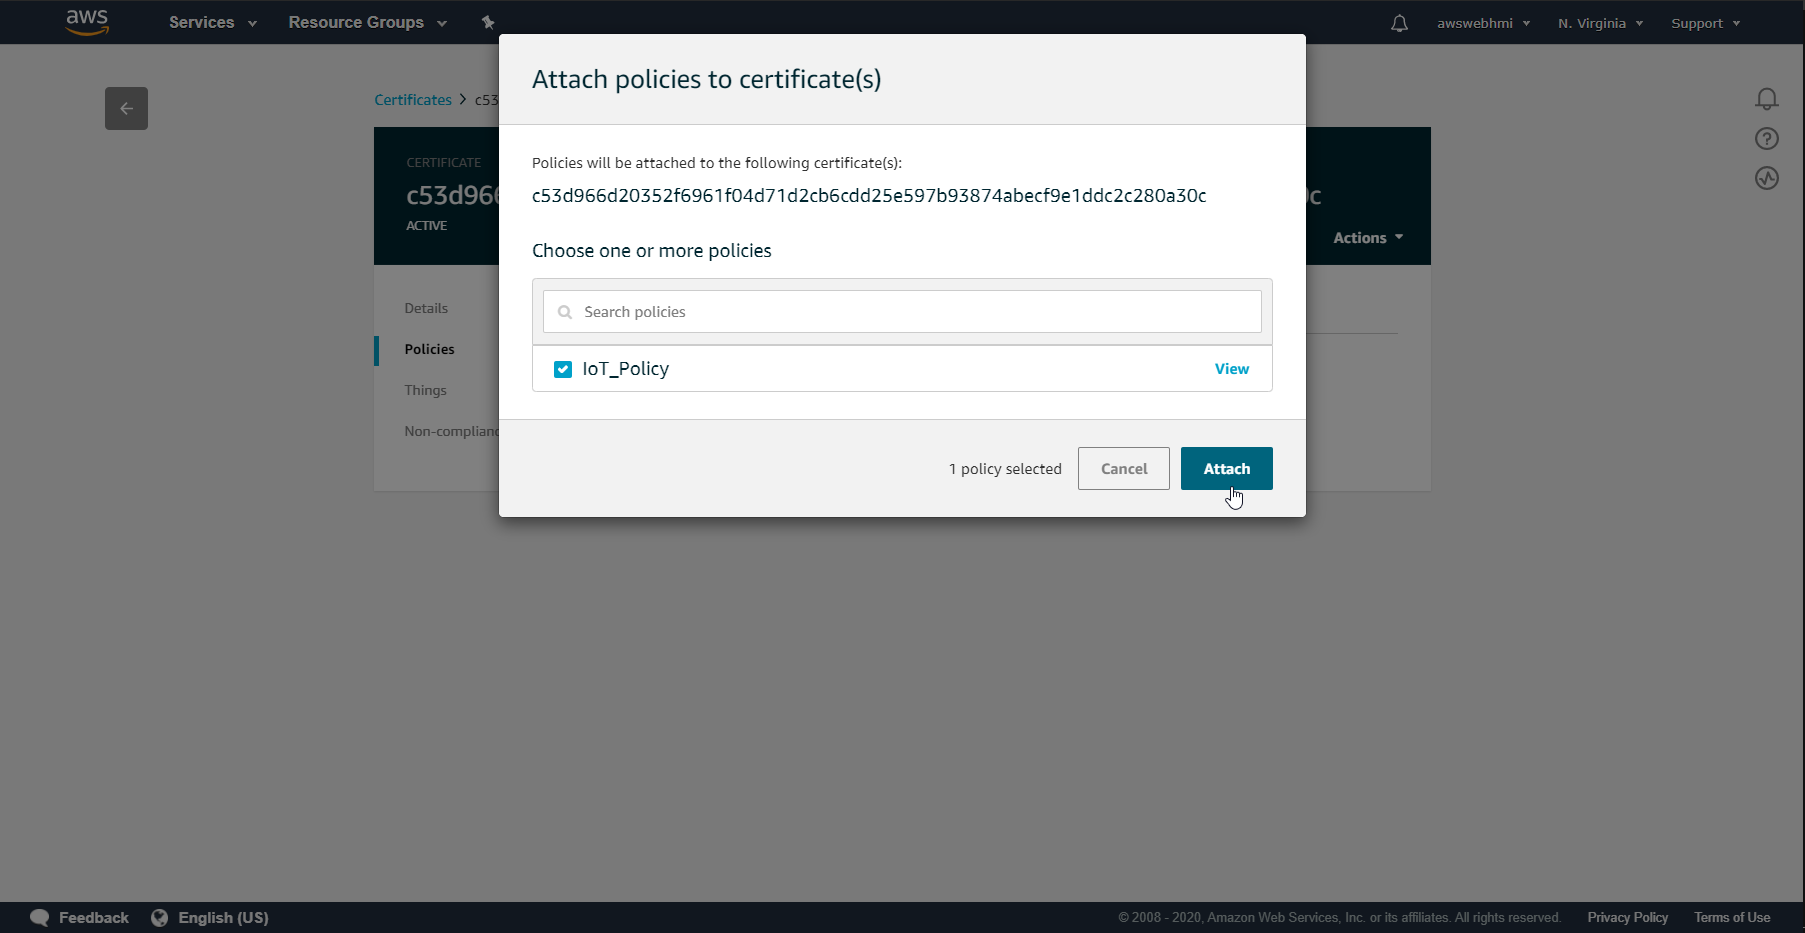 That's how it is should looks like at the final.
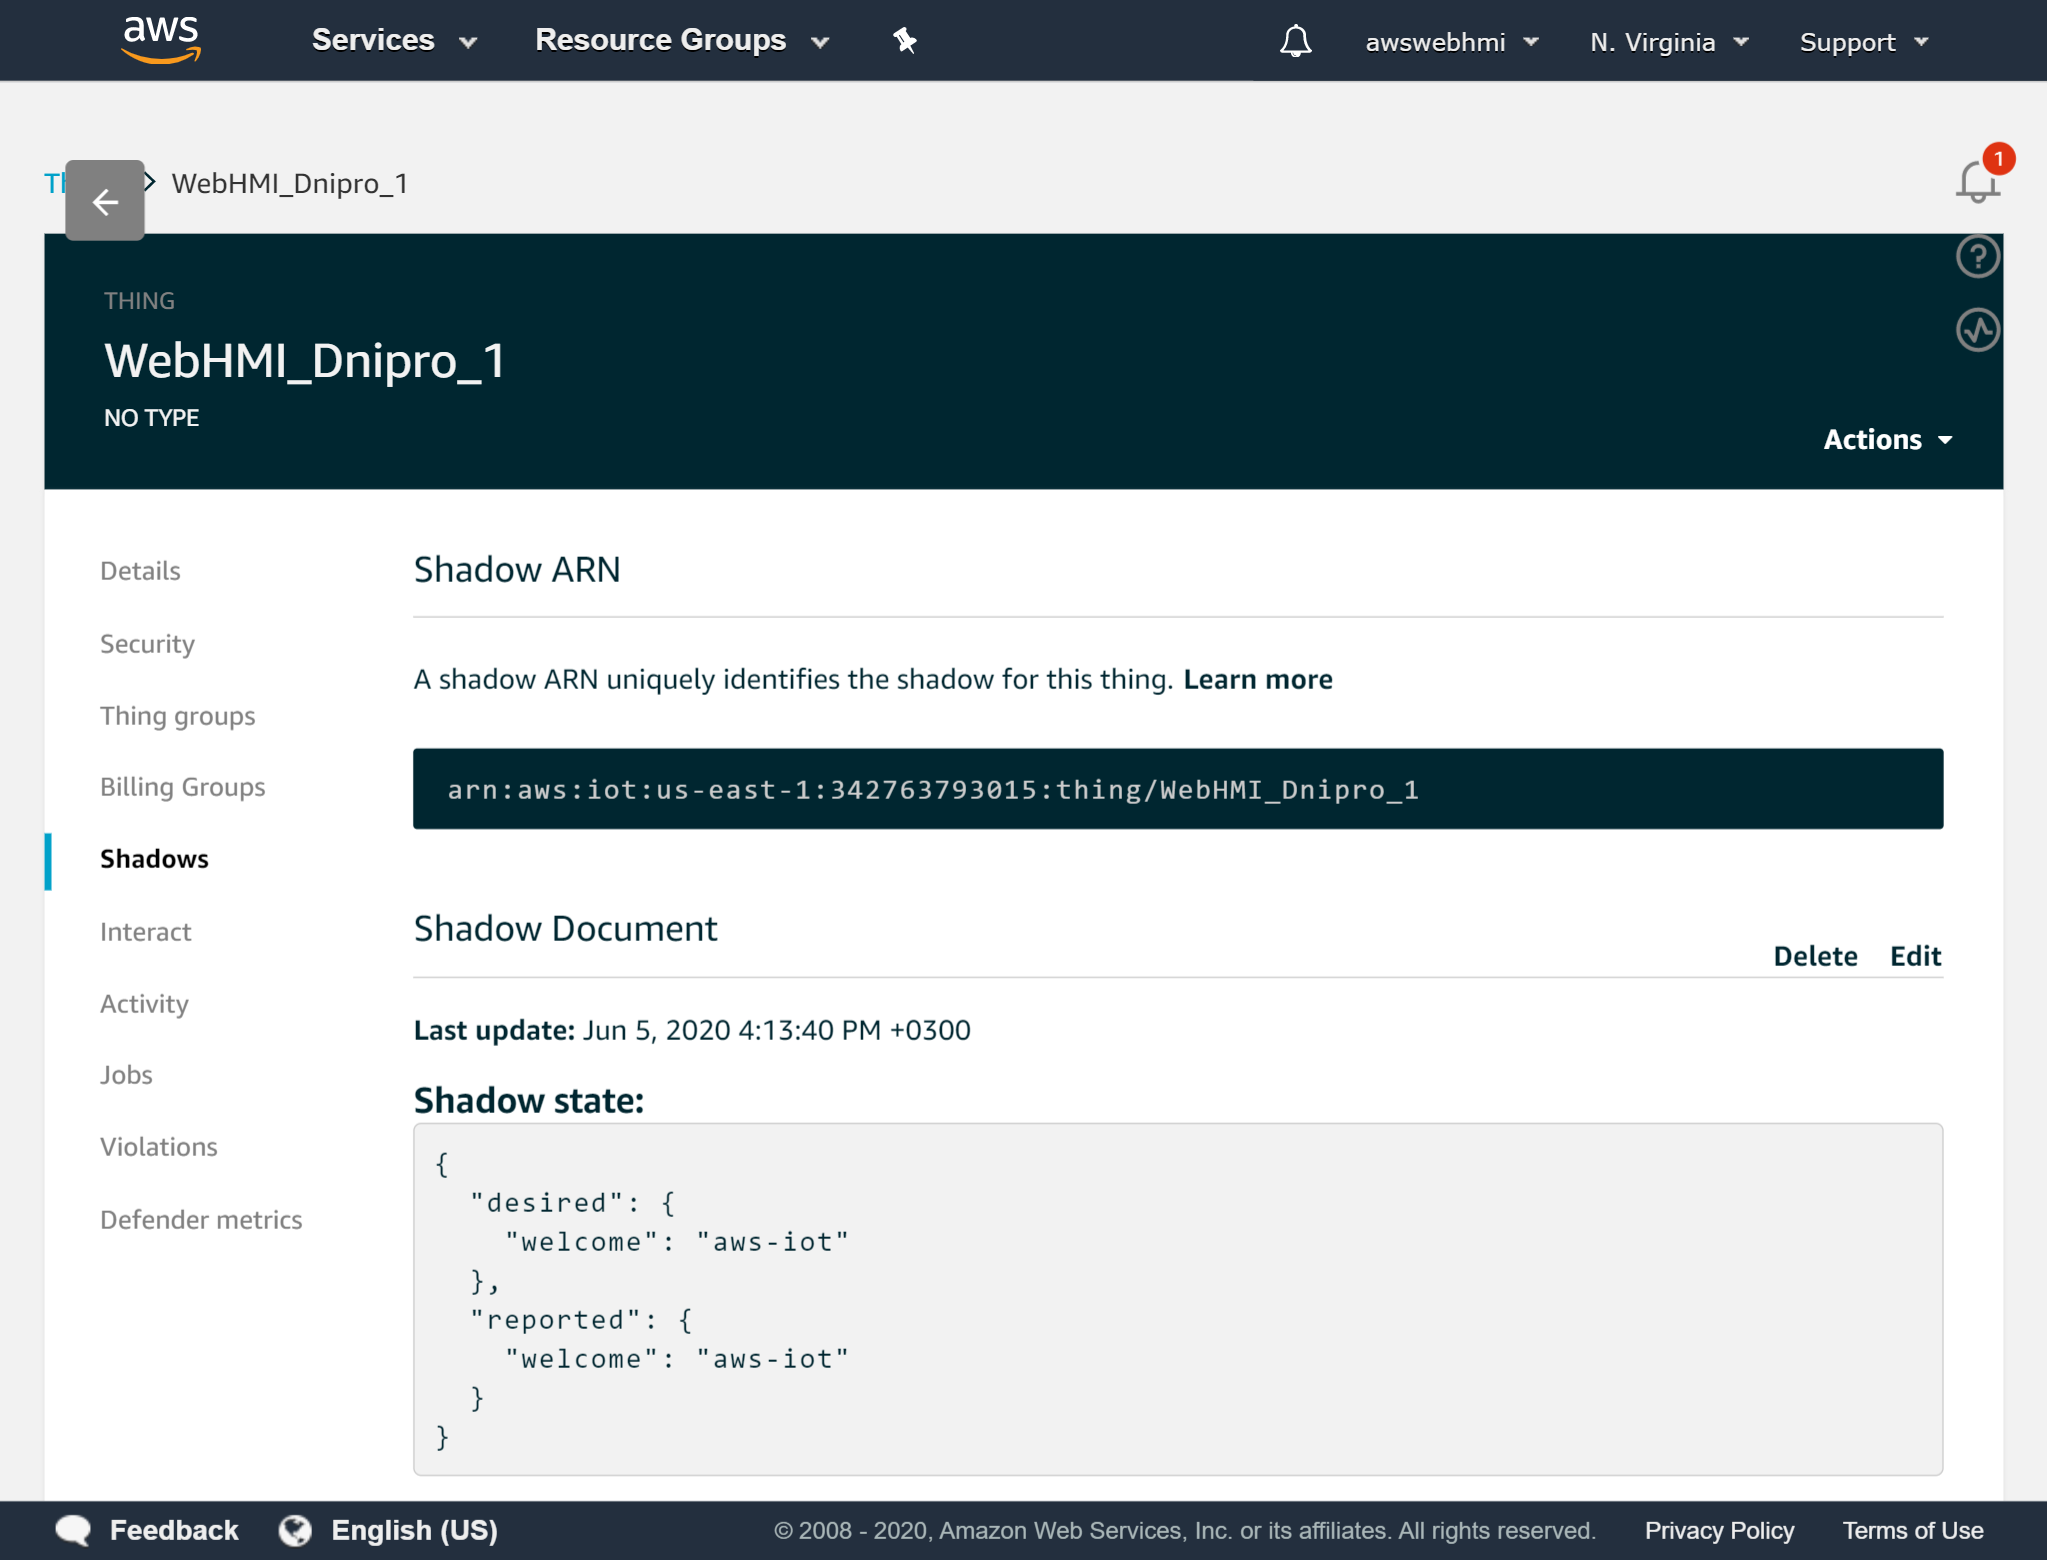
Interact with AWS IoT Device Shadow
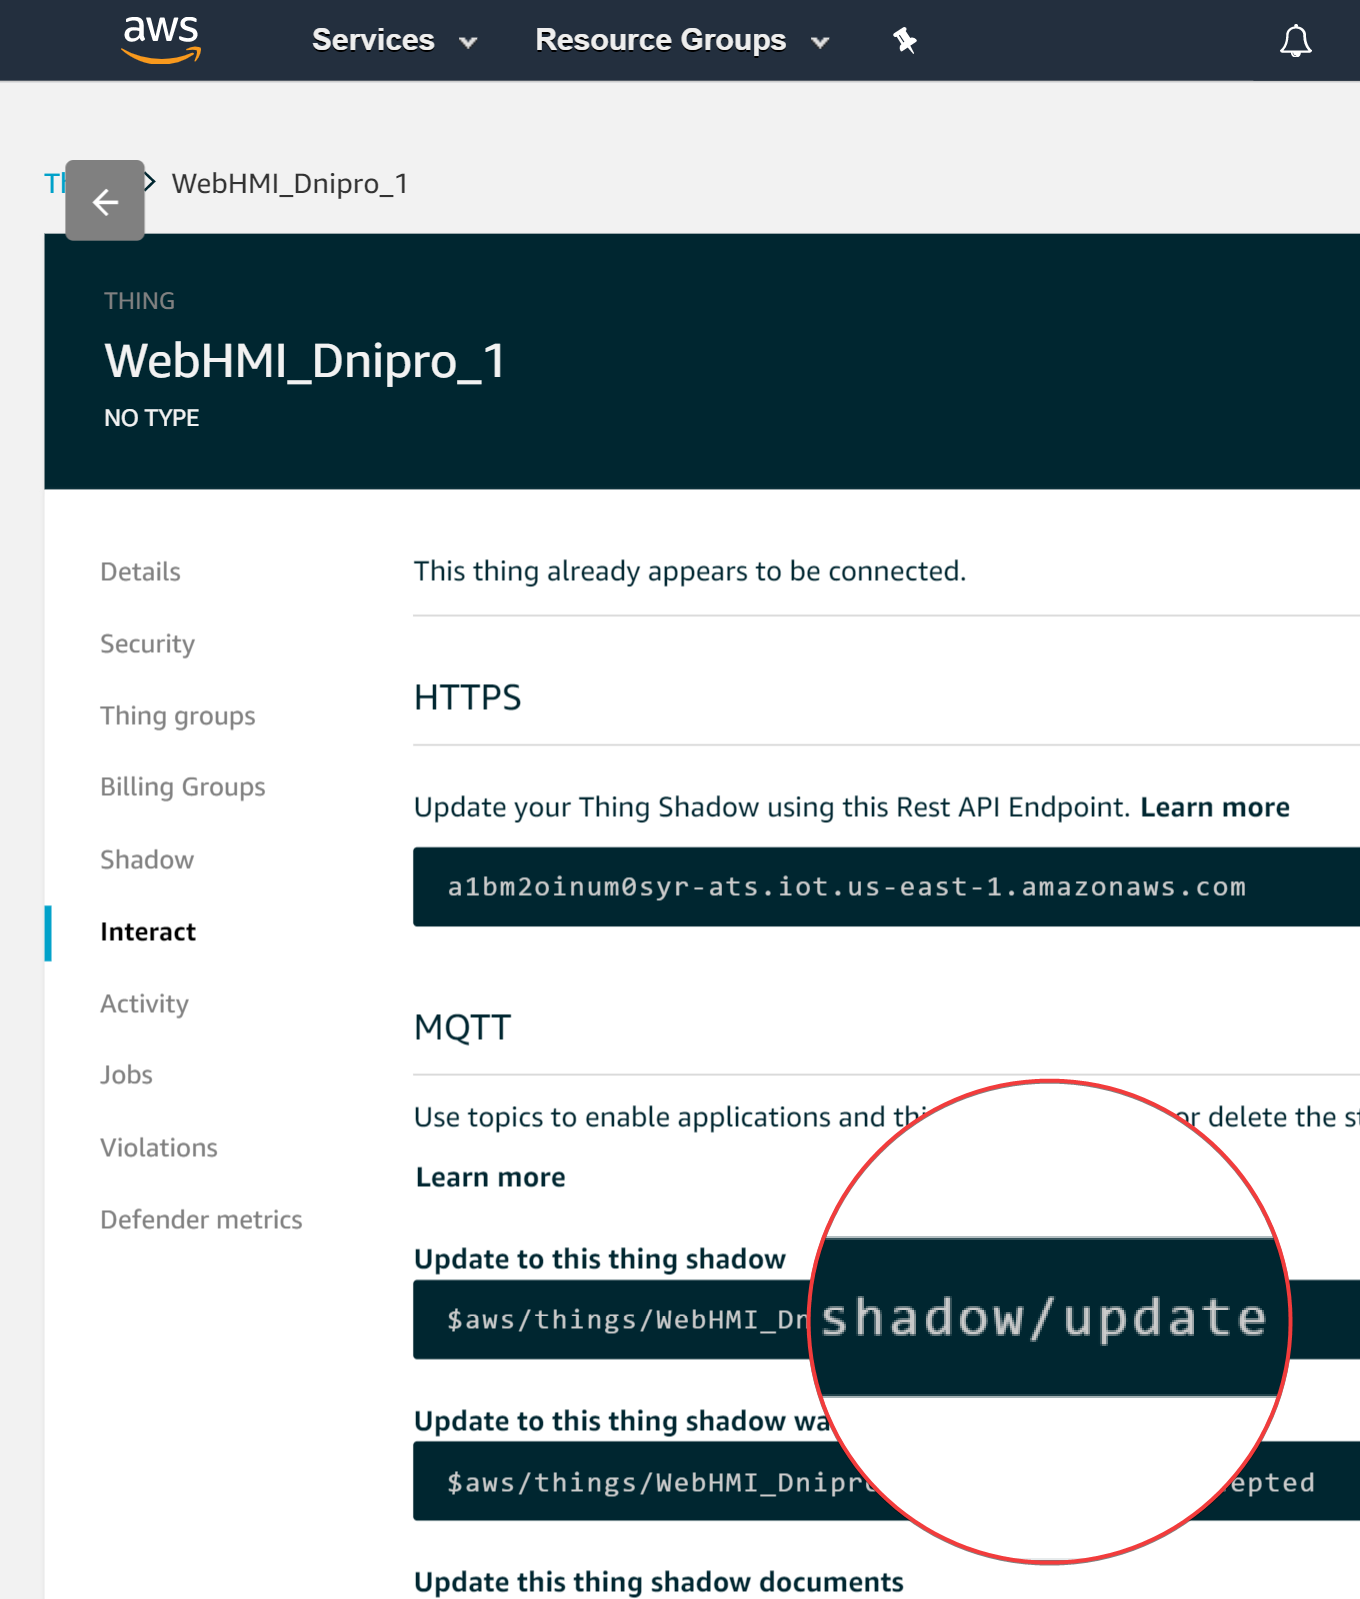
This is the current state of AWS Thing's Shadow. It is representation of last reported state of Thing. It is strict formatted, to found out more follow the link: AWS Shadow format
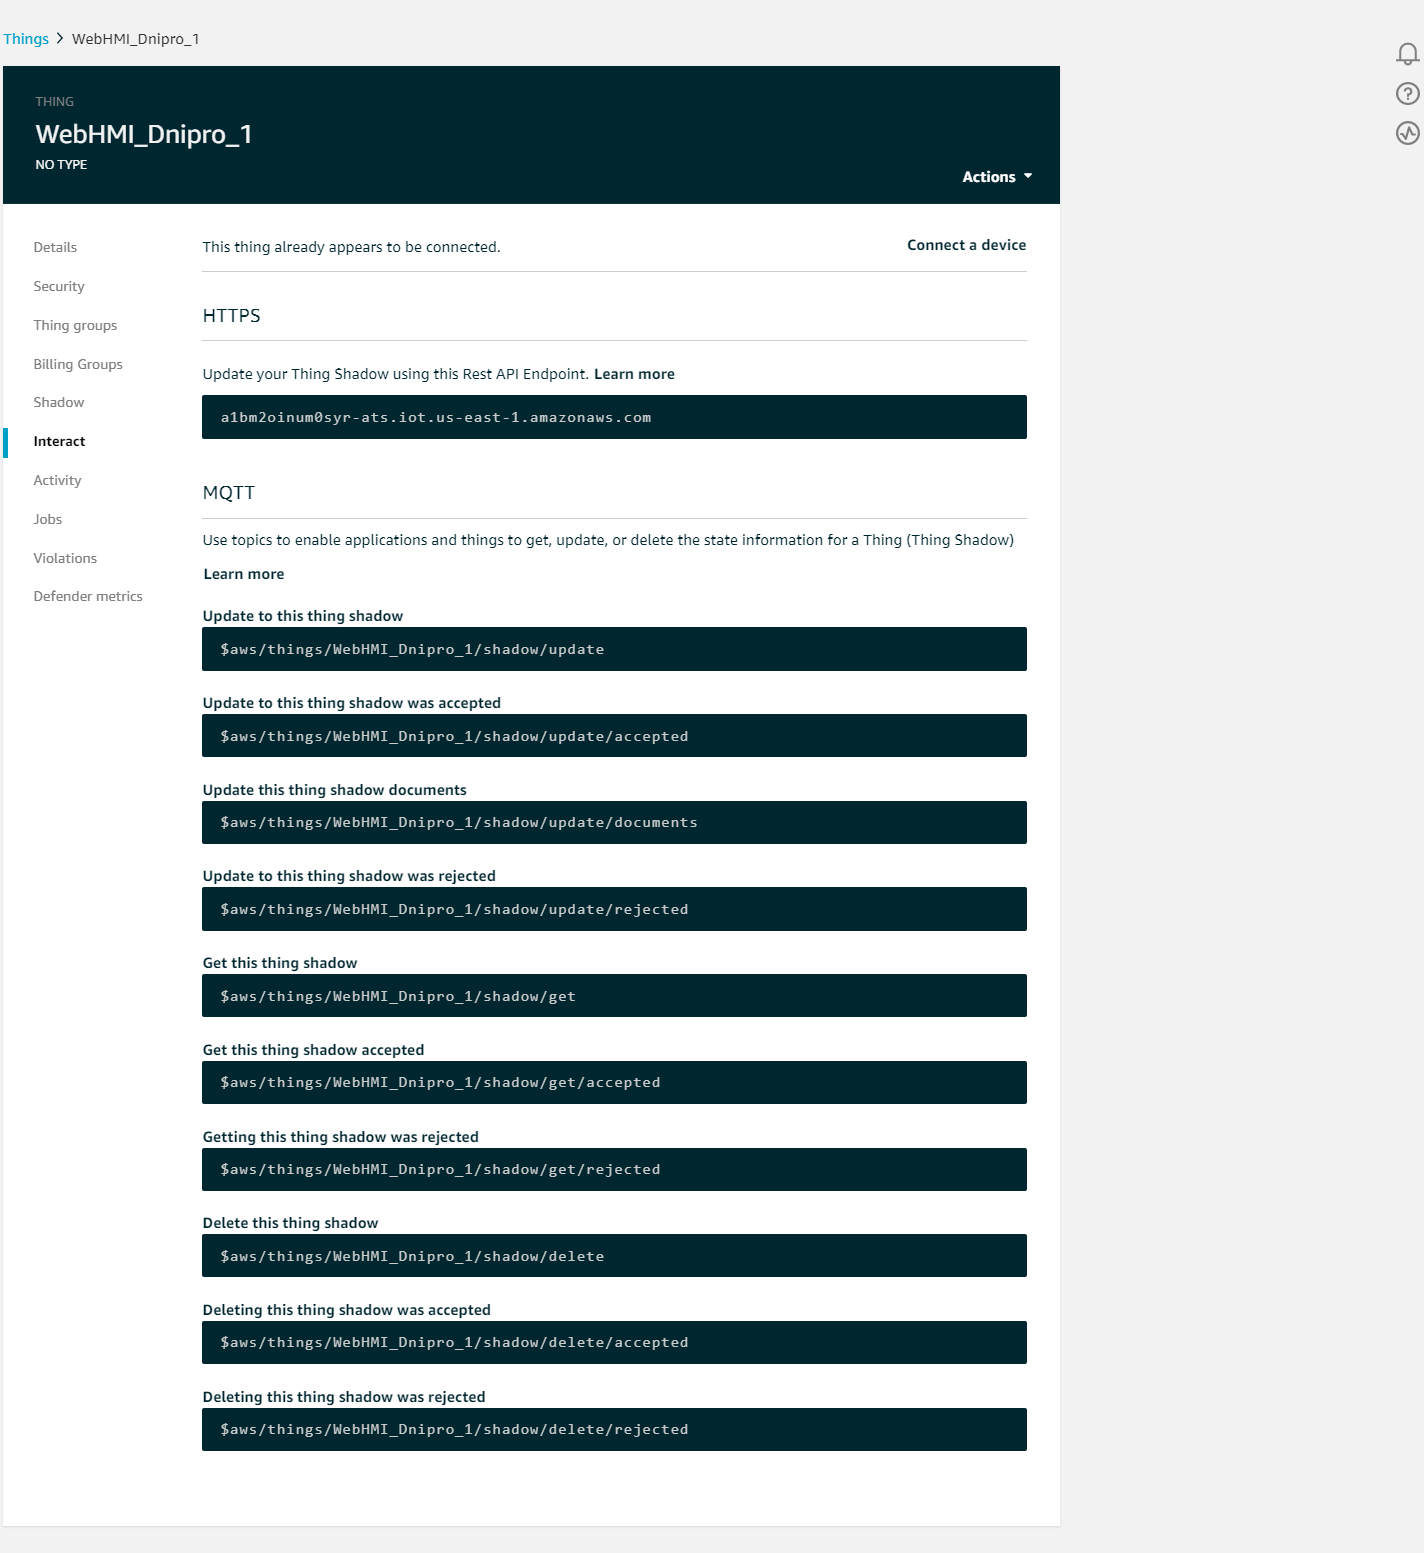
 The “Interact” tab is shows to us all of MQTT topics, so that we can see which metric we shound use to interact with and the responses read from. Also here is endpoint, it is MQTT broker address for our connection.
Test connection via PC client
At the moment all settings done. To test it let's configure “MQTT.fx” to work with AWS through TLSv1.2 using .pem certificates as authorization.
Broker Address is the endpoint in the thing interact settings. According to AWS Developer Guide MQTT Broker Port is 8883.
In the end, this leads us to these settings in MQTT.fx to test the connection.
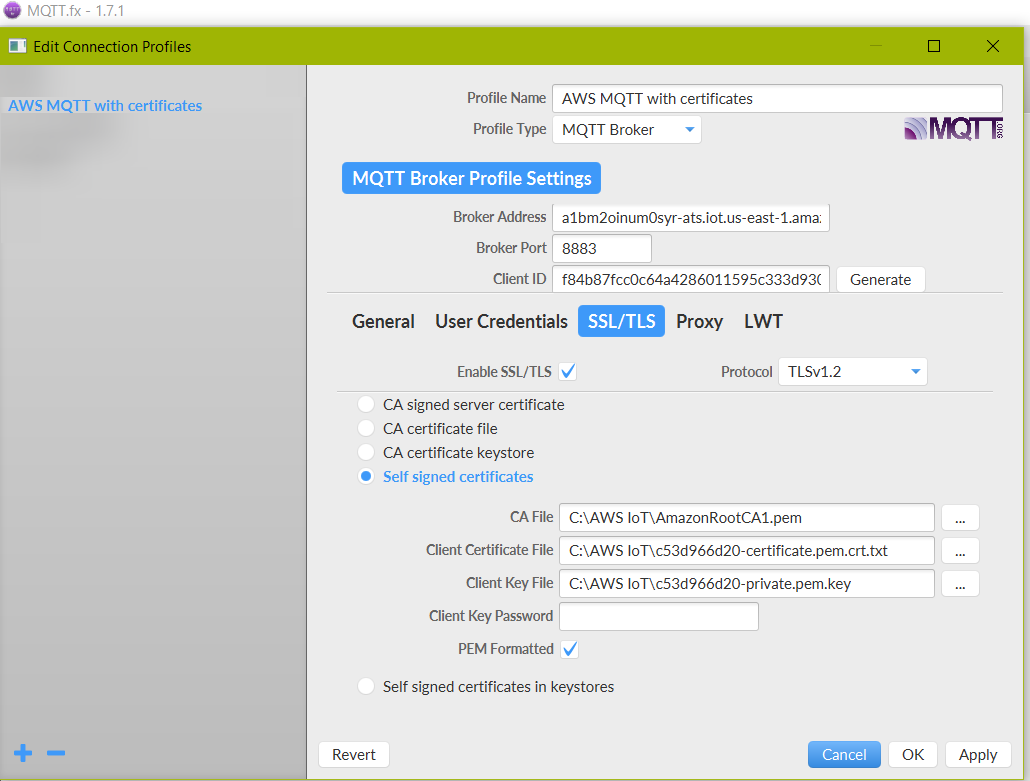
Click the Apply and try to connect to AWS MQTT Broker. If settings are correct the connection will be established and indicator will be green.
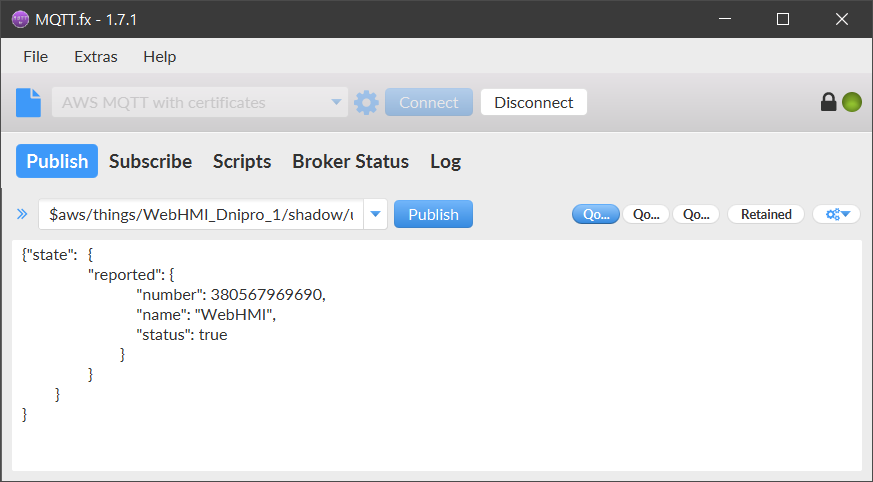
Let's test shadow change:
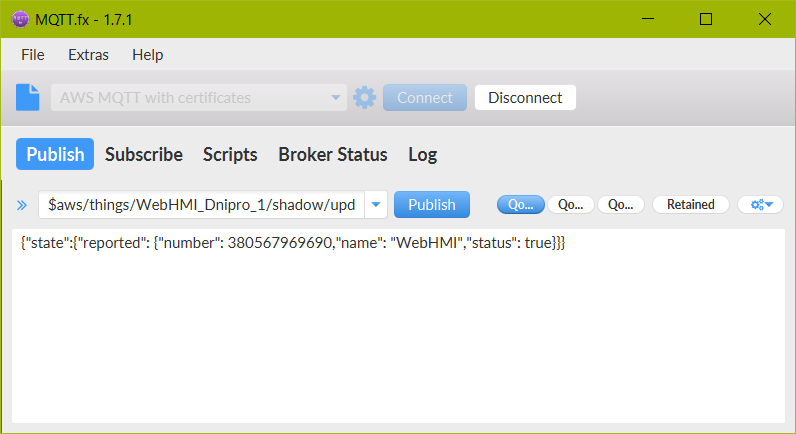
Copy the “…update” MQTT topic from Interact tab to “Publish” form.
 And construct the JSON formatted message to update the shadow.
- MQTT Publish shadow update.json
{
"state":{
	"reported": {
		    "number": 380567969690,
		    "name": "WebHMI",
		    "status": true
		    }
	}
}
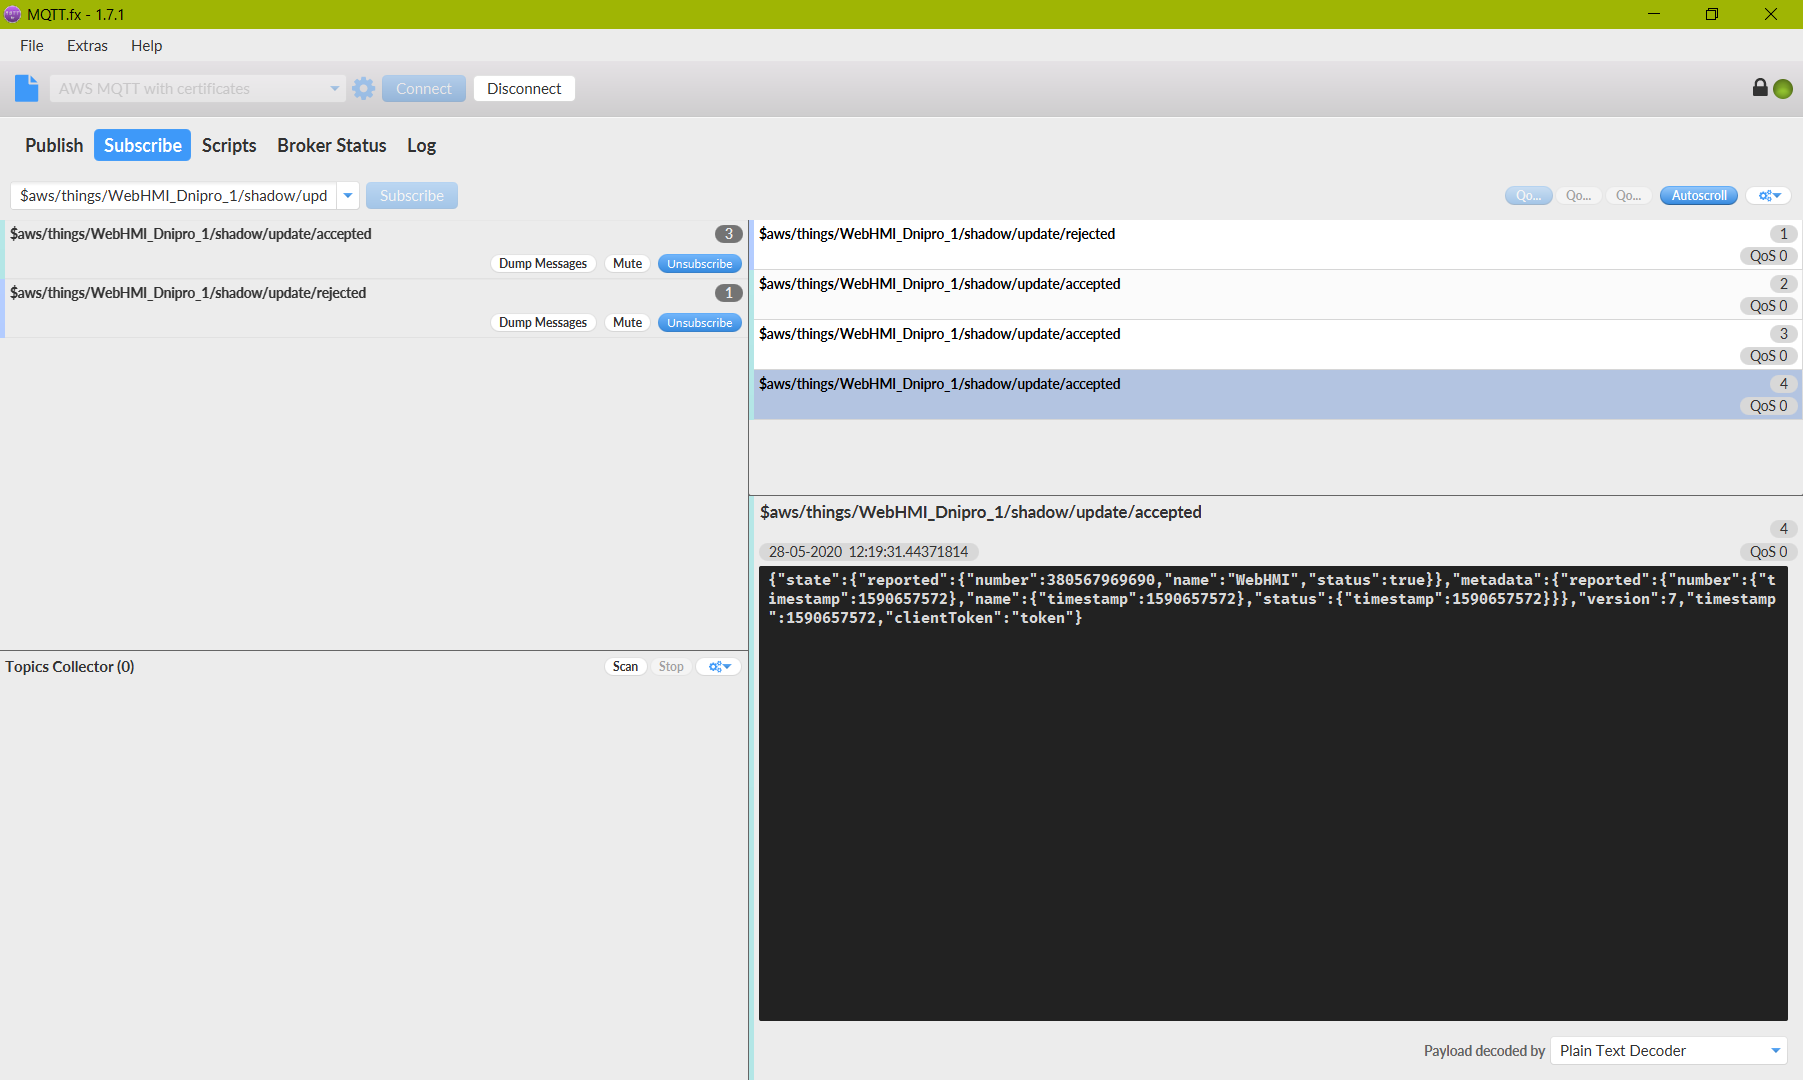
 In case of mistake in the JSON format it will be received to
 “…rejected” topic message:
 When everything is configured well, the publish to
 “…update” topic will lead to “…update/accepted” message with retelling of your payload.
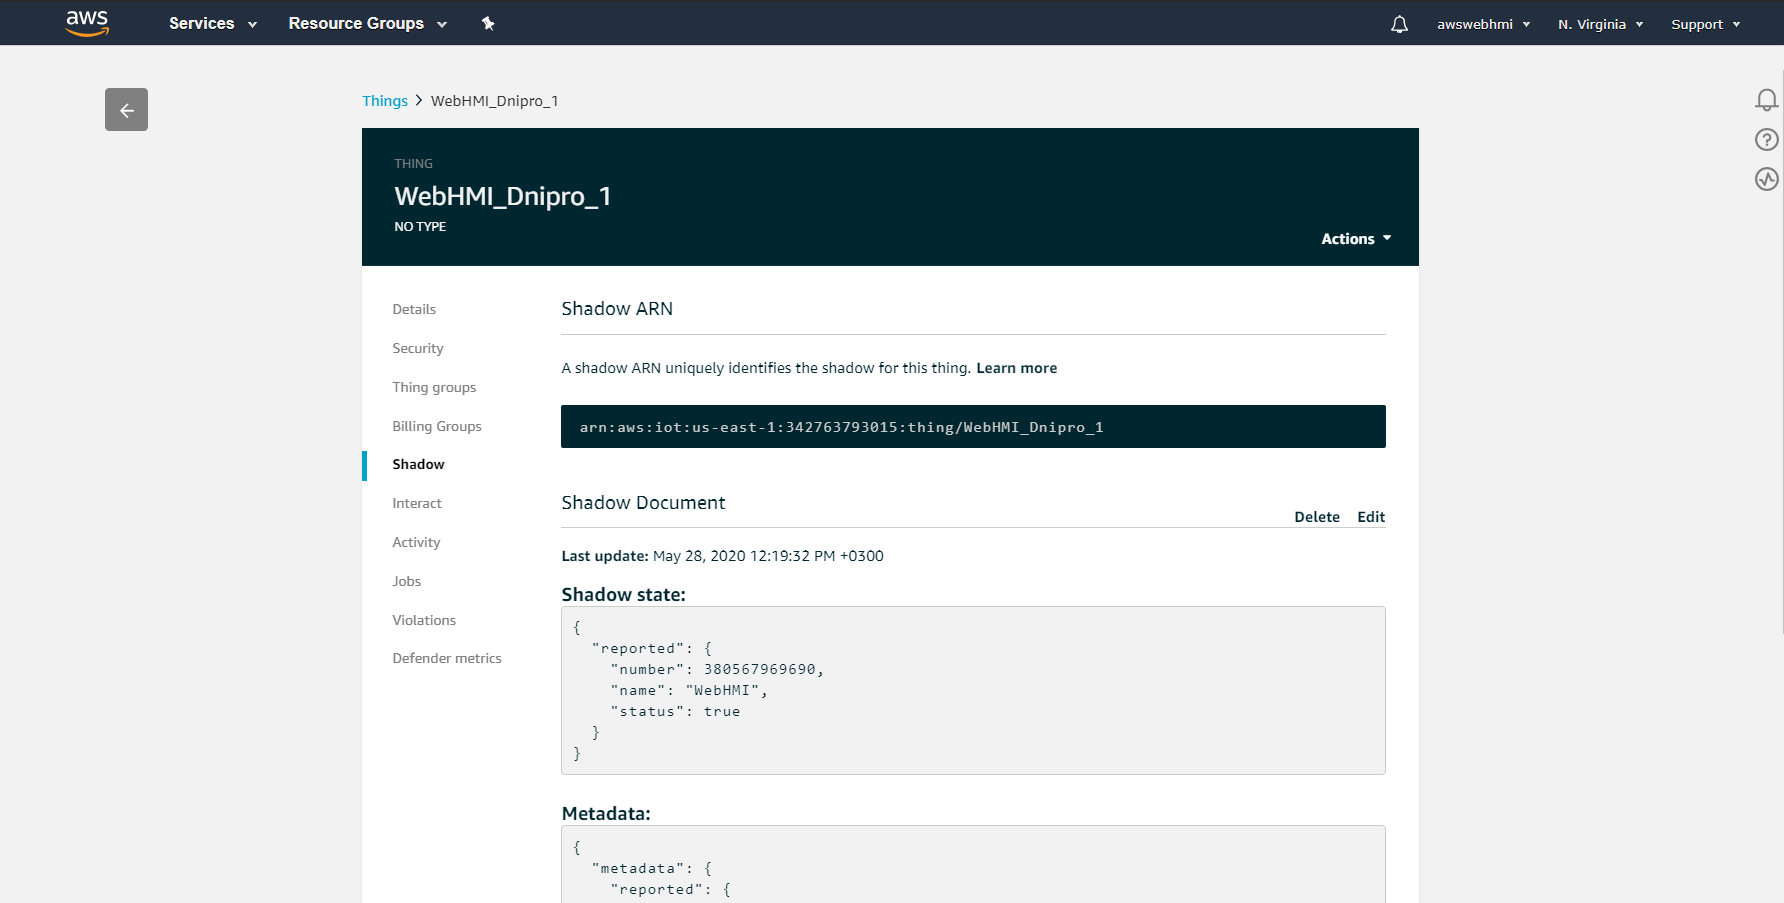
 So that, you can notice that Shadow is holds last manual reported state.
IoT Core Act/Rules
To take advantage of the data received from the Thing, there is created Rules in Act menu. This is the way to process data, such as head it to analytic or visualisation tools such as QuichSight or Kibana and also run any user actions. Now then create a rule, that will store data in the database for the beginning. The native AWS IoT database is the DynamoDB. To do this you will need create a Table, configure trigger to pull data to it, and apply policy that will allow different AWS service to interact. Let's begin!
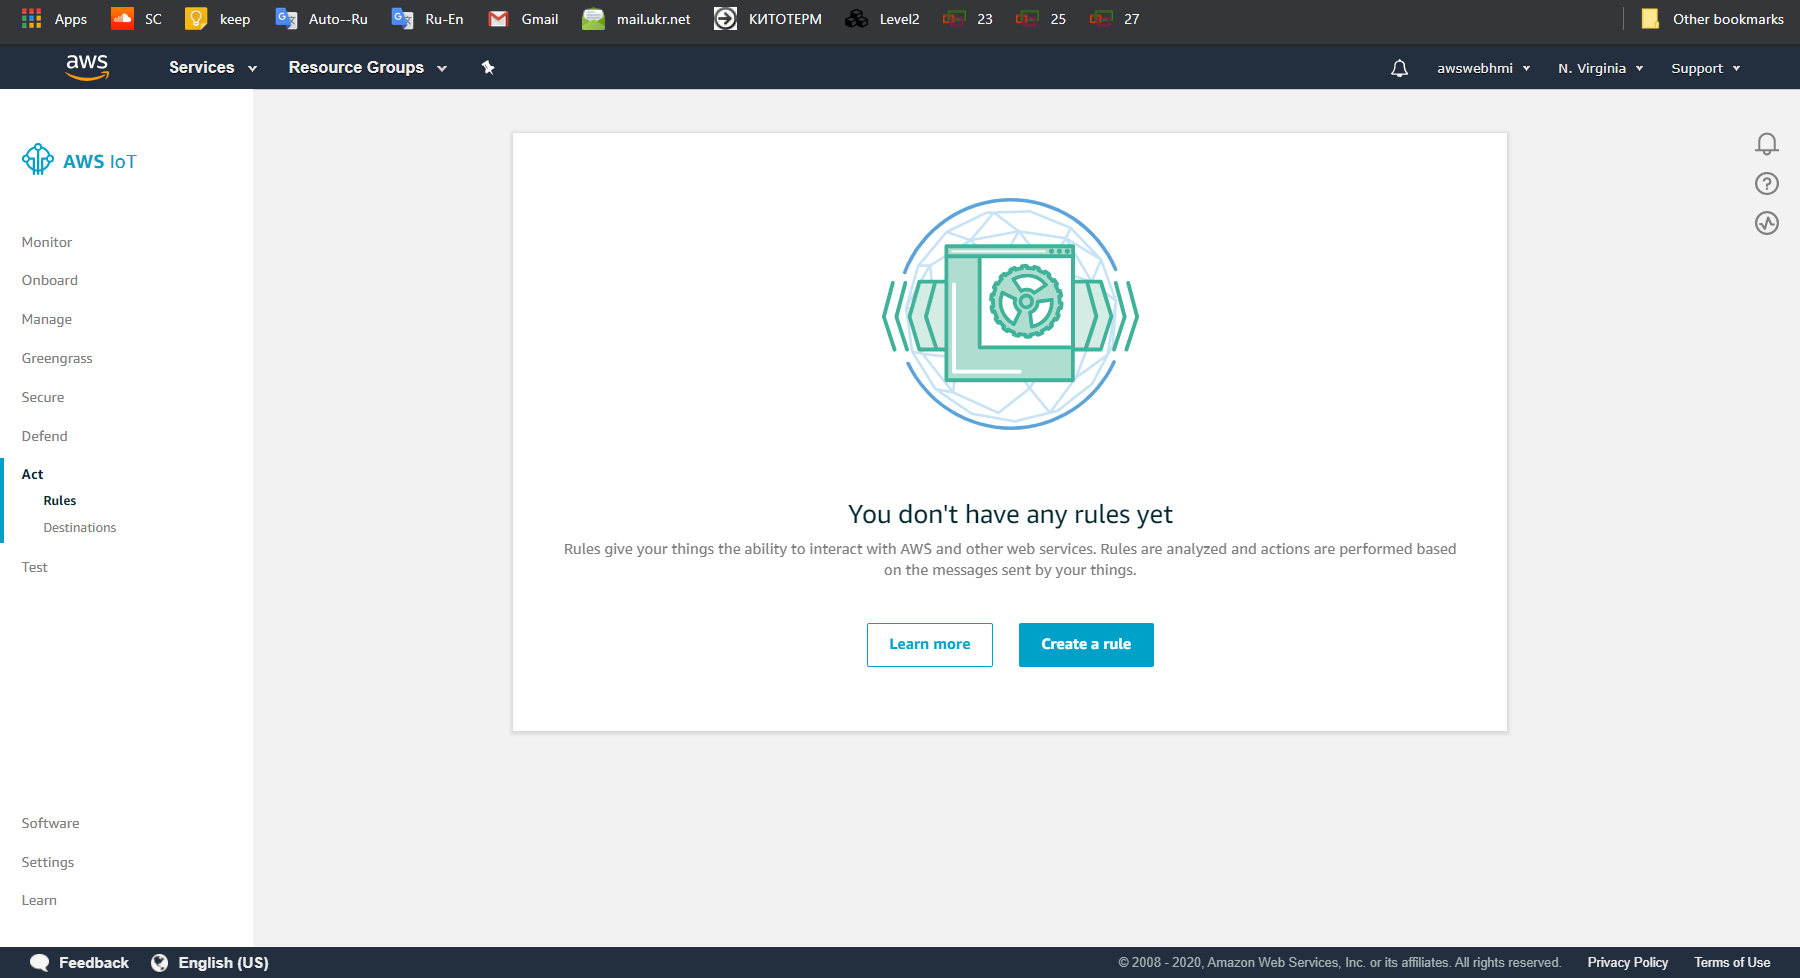
Go to AWS IoT Core, Act, Rules. By default, there is no any rules pre-created.
 Click at “Create a rule”, fill in Name. Be careful, it is unchangeable after the creation process.

Just fill in the wildcard in the SELECT clause and topic in the FROM. In our case it is:
SELECT *
FROM '$aws/things/WebHMI_Dnipro_1/shadow/update'
By using wildcard symbol we skip the SQL processing, but we will consider it later. For now, click at “Add action”.
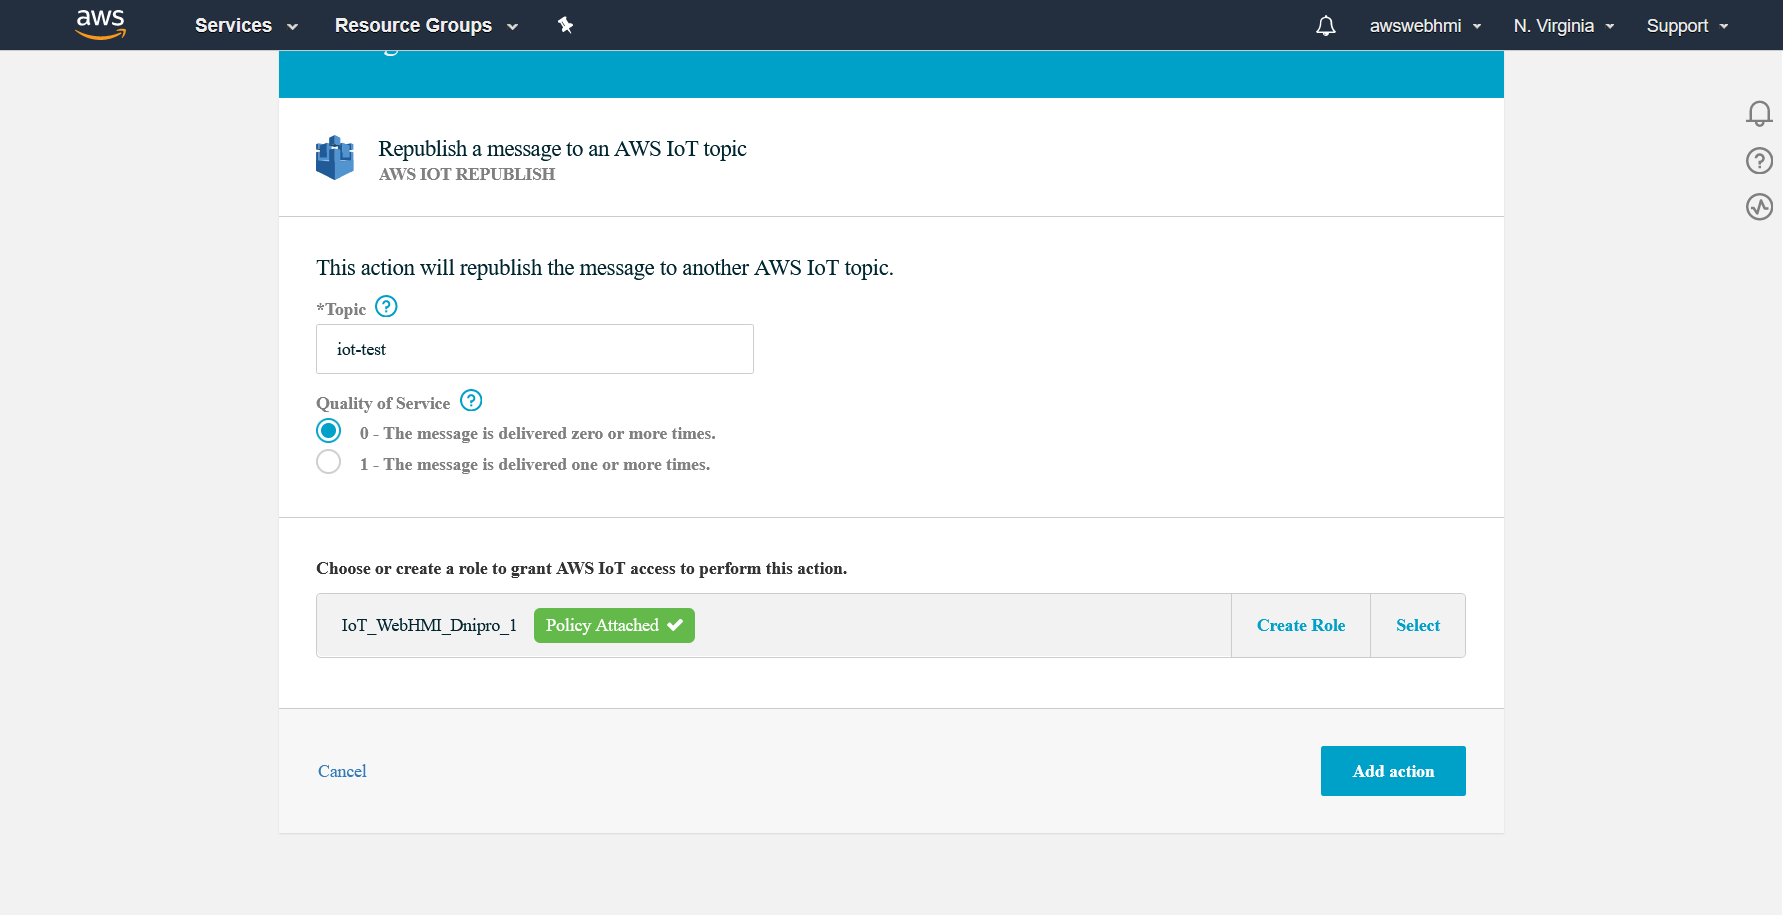
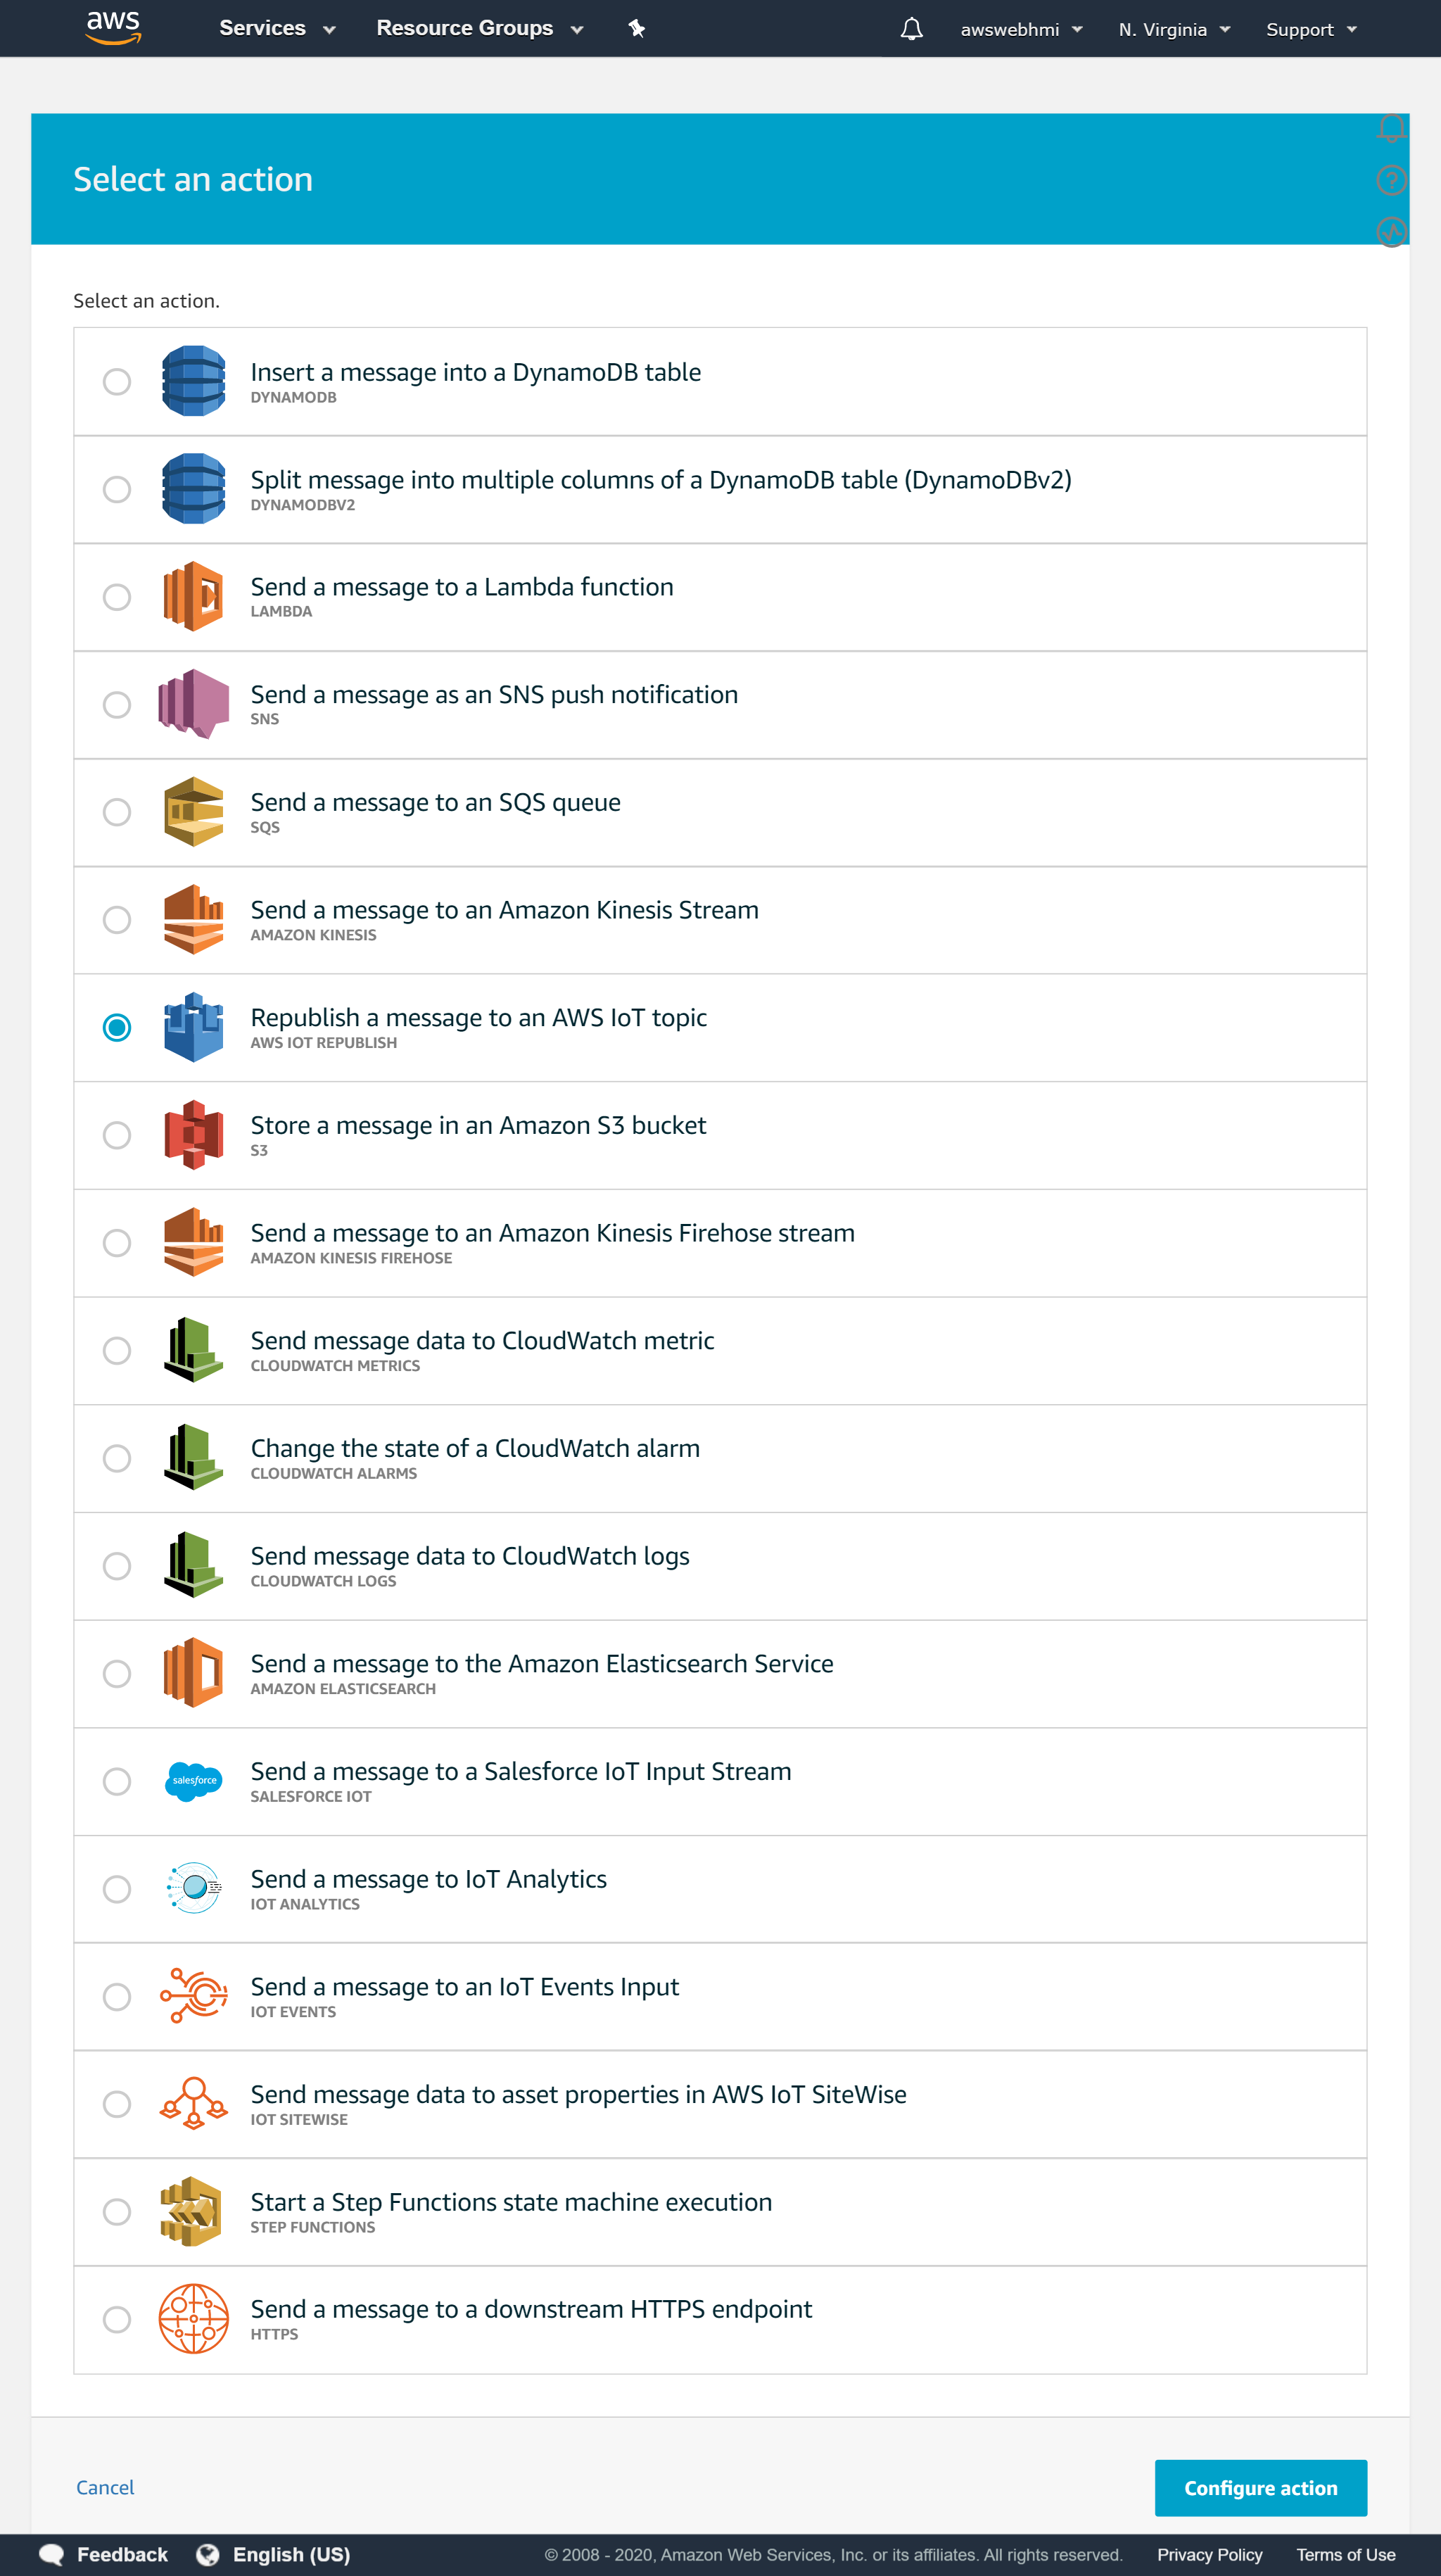 To test action is working let's just republish the whole JSON payload in the another MQTT topic. Using SQL query it will be possible to filter and even reformat it. So that rule has potential power.
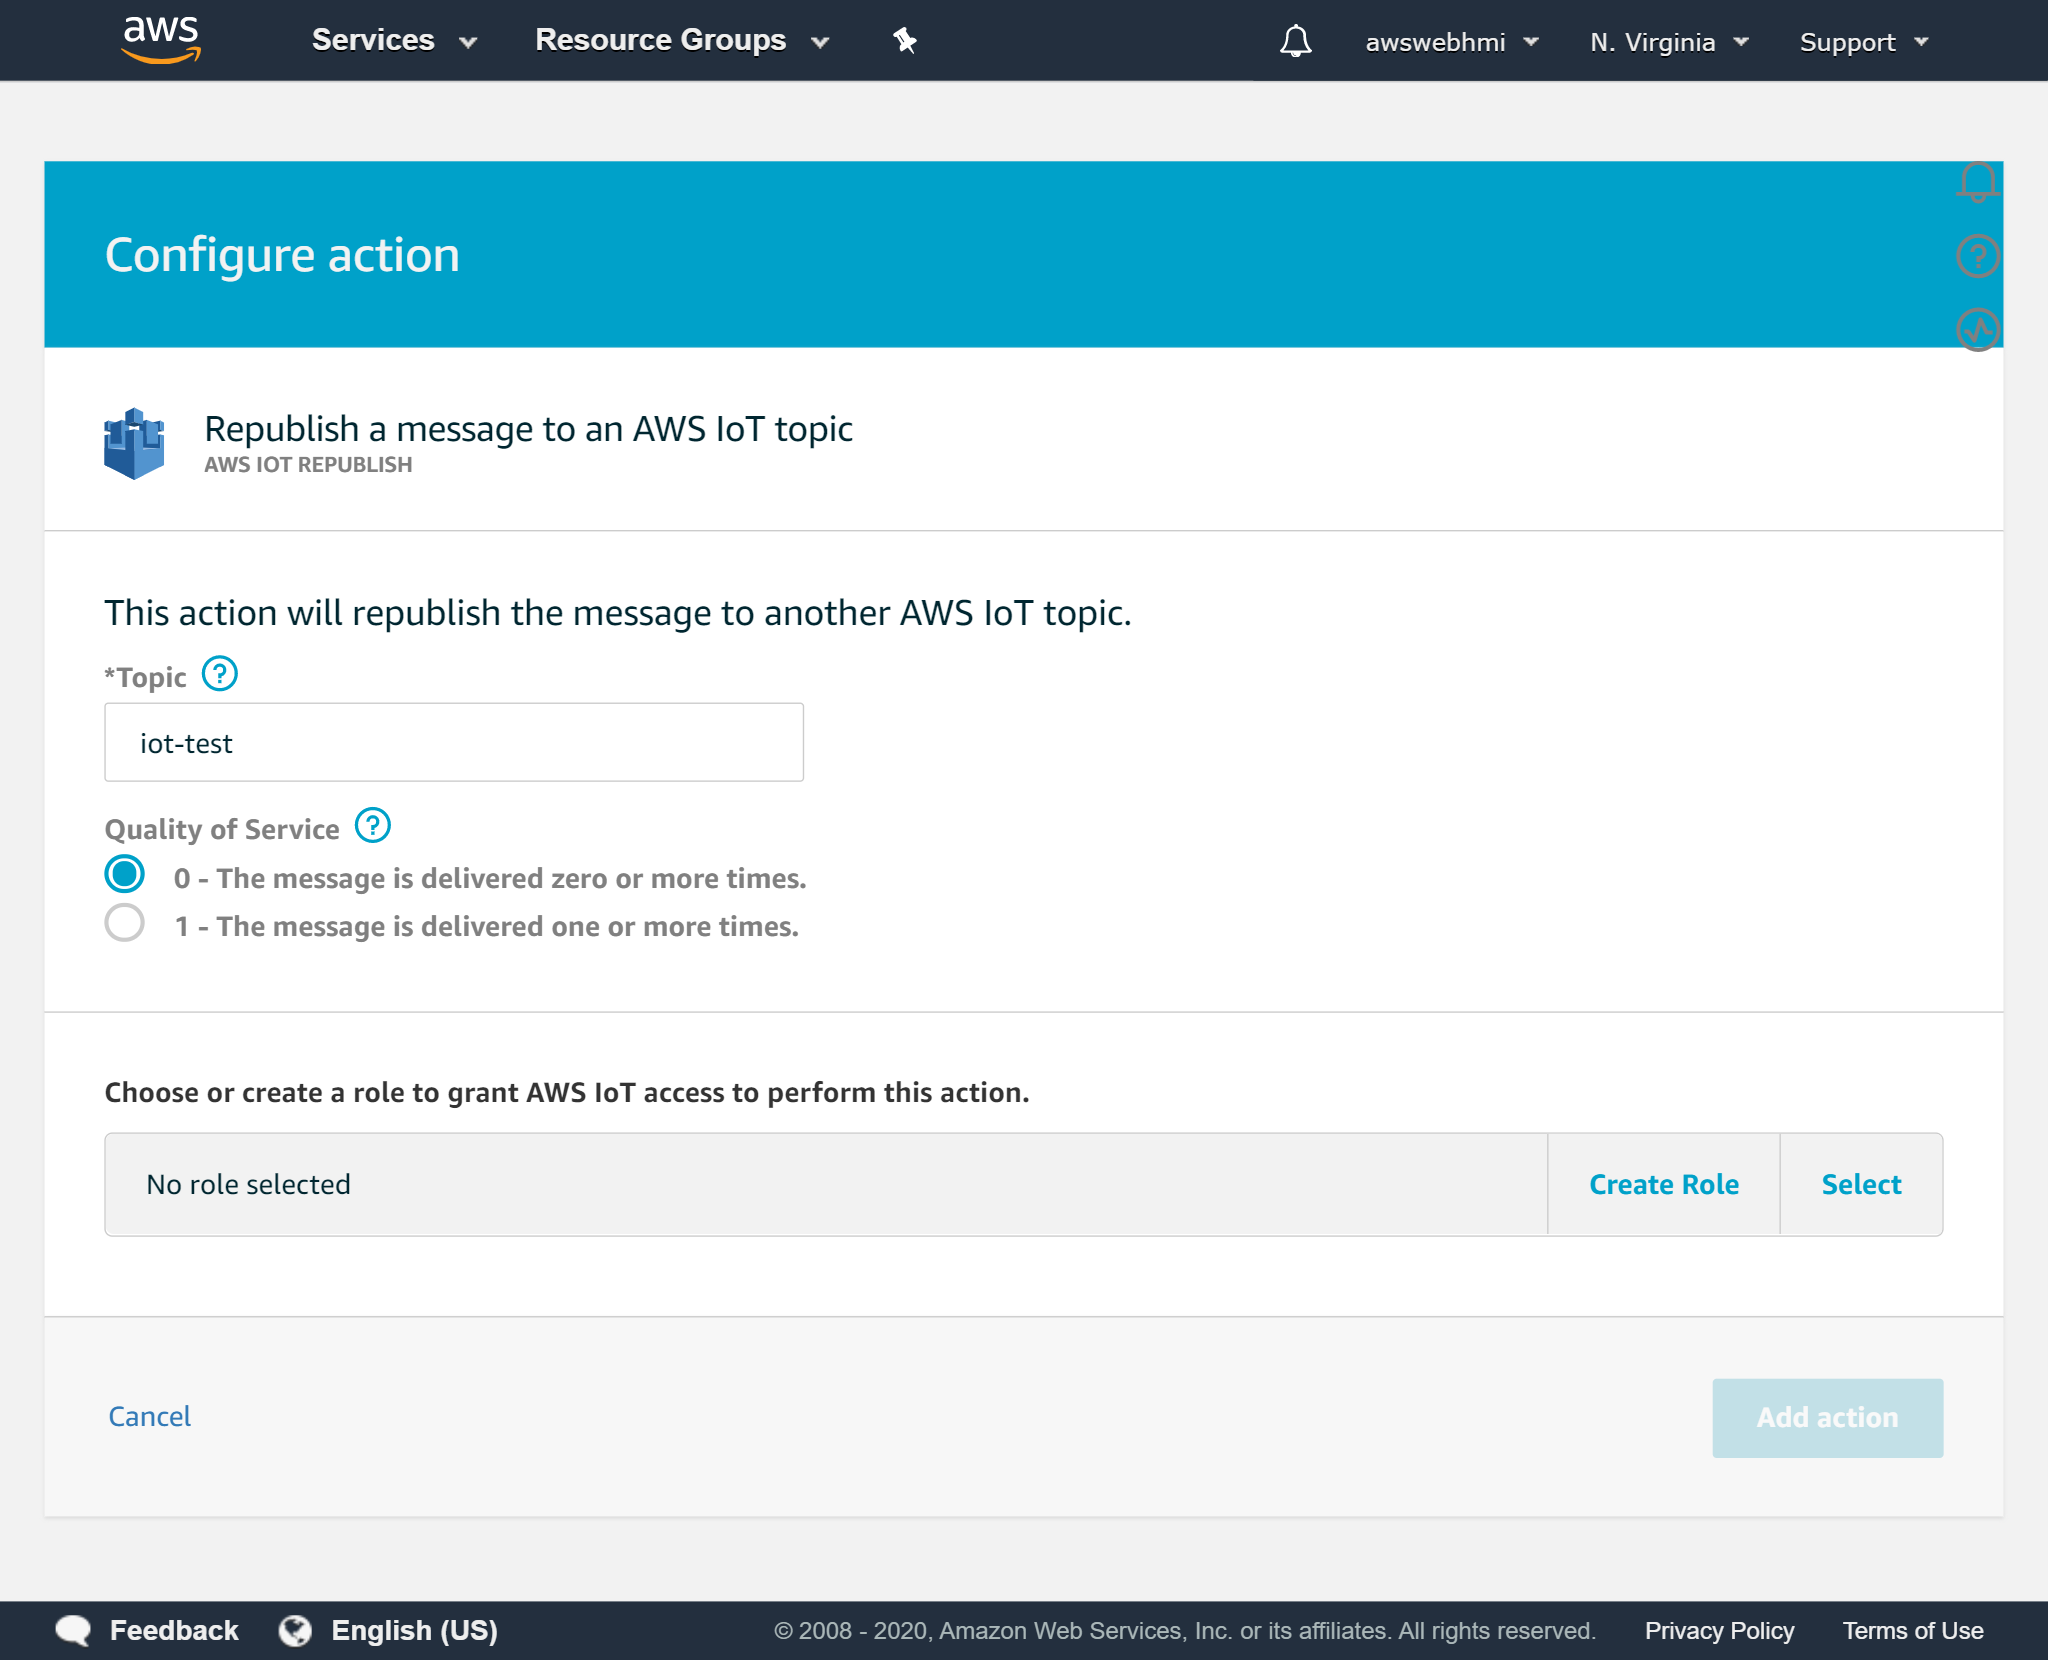
Fill in a new for testing purposes MQTT topic just to republish the whole message. “
To test action is working let's just republish the whole JSON payload in the another MQTT topic. Using SQL query it will be possible to filter and even reformat it. So that rule has potential power.
Fill in a new for testing purposes MQTT topic just to republish the whole message. “iot-test” for example.
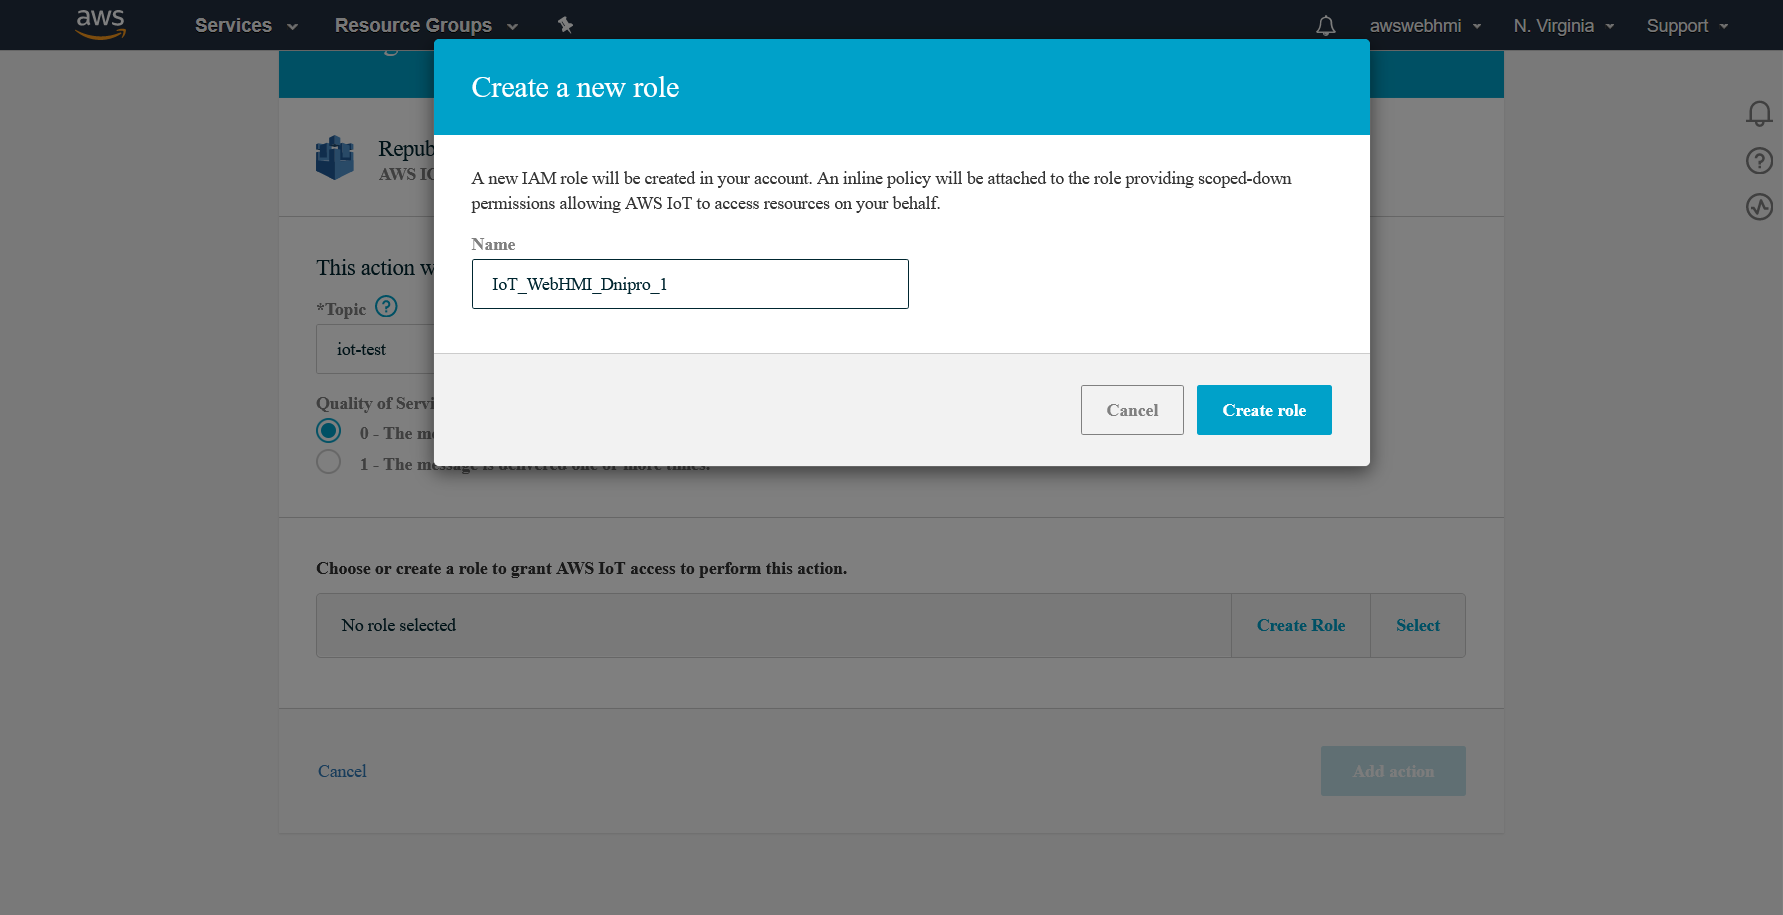
 To be able to publish messages it is a role should be applied with a policy that allows it attached. Click at “Create role” and fill in the name for it. It can be renamed, so do not think a lot, try to work out the namespace regular expressions and make the naming process systematic.
 After the role created and appropriate policy attached, you will see the “Policy attached” label, which indicates that rule will work with this action and IAM will not prevent action according to this rule, in our case which is republishing message.
Also, to indicate that something went wrong, but the IAM configured well, let's create an error action, same republish but in an “error MQTT branch”, such as iot-error.
 When those configurations are done, let's test it and pursue that it is working fine.
This time, we will use AWS MQTT Client, which can be found in IoT Core, Test.
To start testing you need to subscribe to all of three topics that you use in your rule. It shound be
When those configurations are done, let's test it and pursue that it is working fine.
This time, we will use AWS MQTT Client, which can be found in IoT Core, Test.
To start testing you need to subscribe to all of three topics that you use in your rule. It shound be iot-test, iot-error, and $aws/things/WebHMI_Dnipro_1/shadow/update topics.
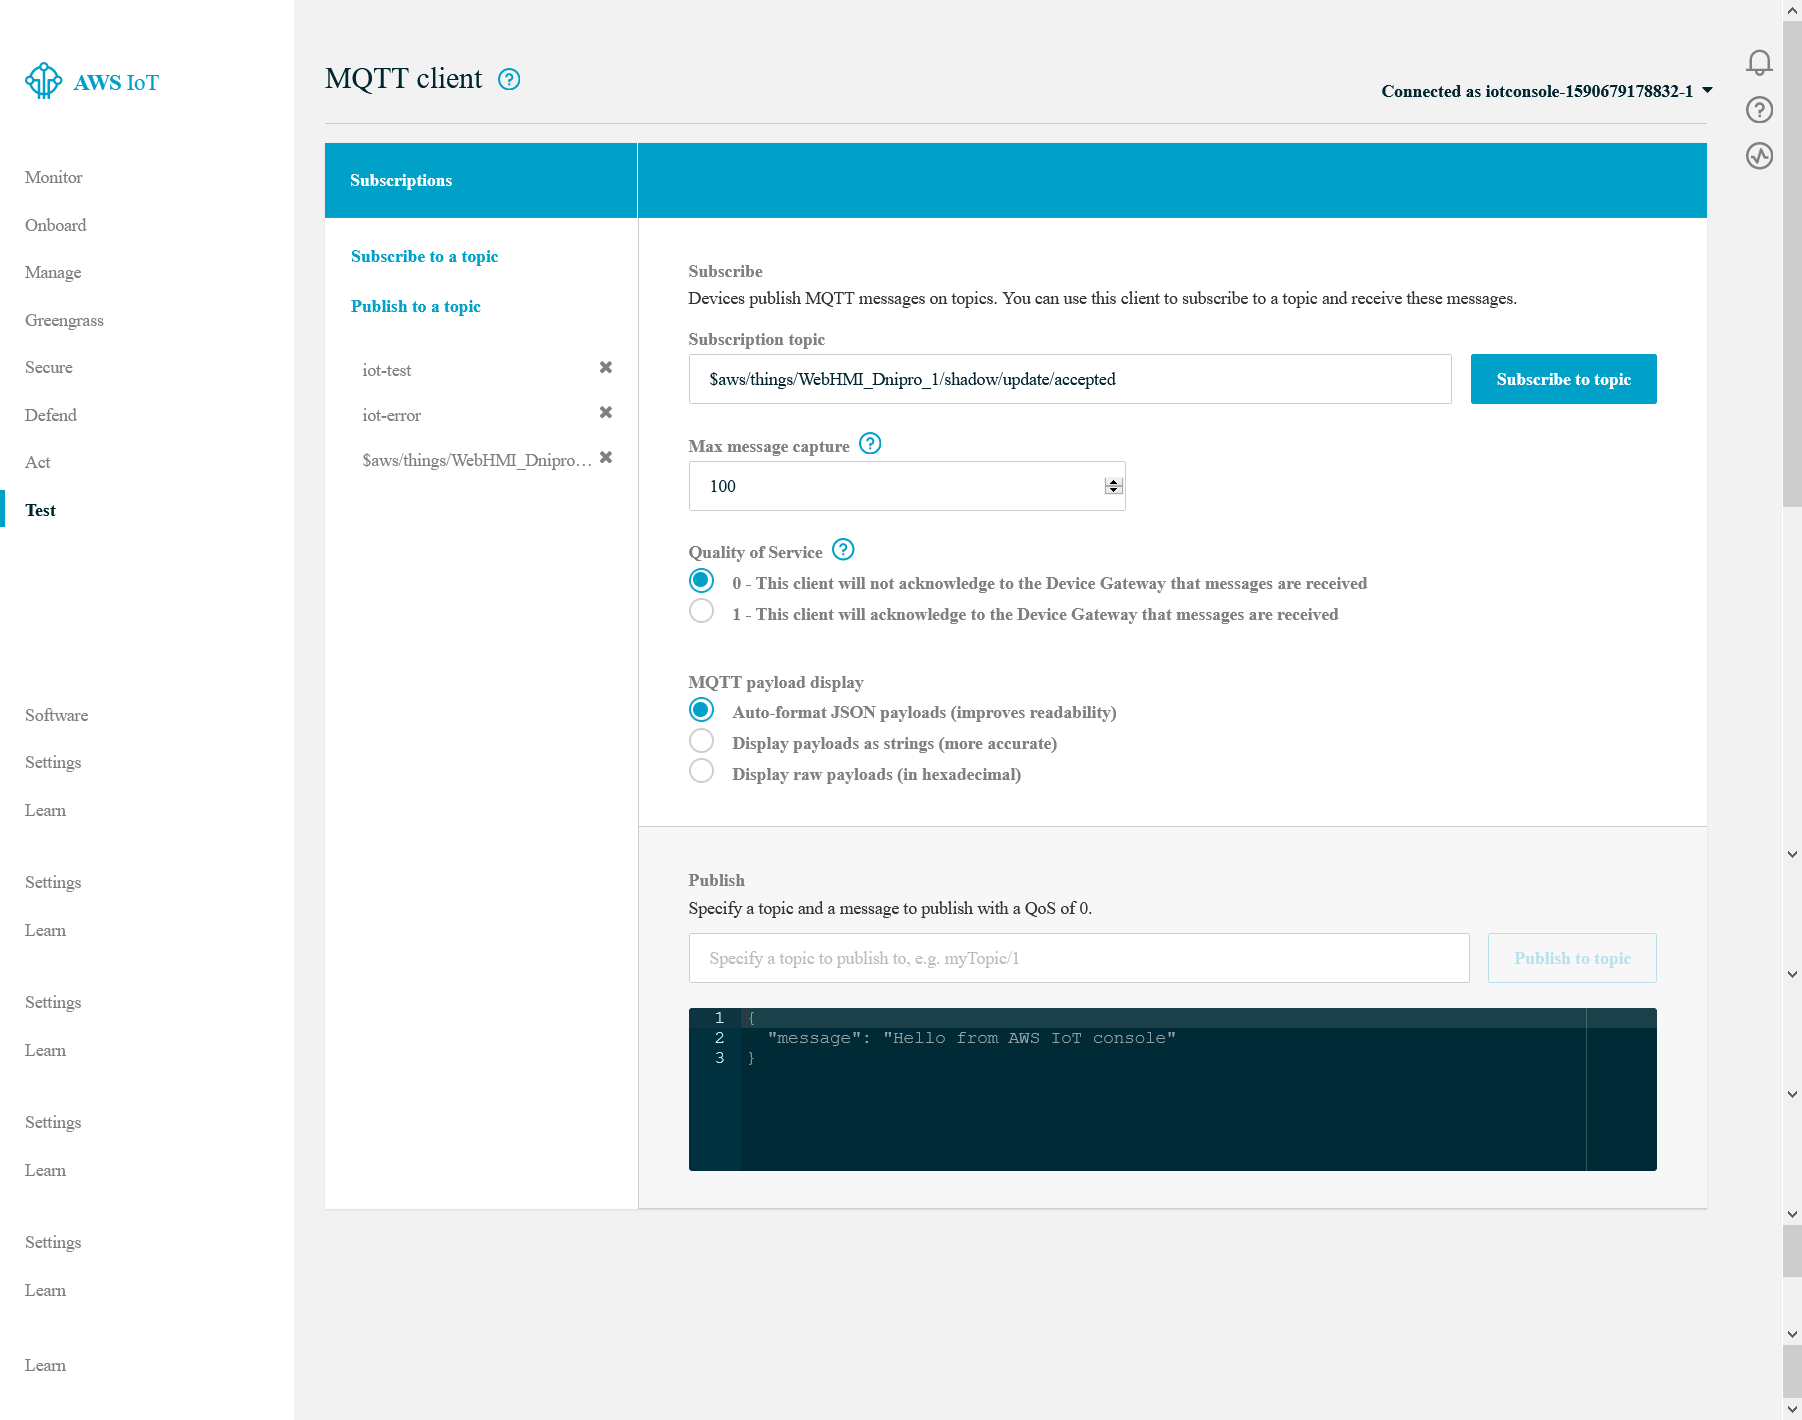 Test algorithm is to post JSON formatted message to
 …/update message and see that it is reposted either to iot-test or iot-error topics, which will indicate that rule is applied and actions triggered by rule is not prevented to execute according to IAM.
 When to whole message is republished, so now you can configure SQL query filtering. To explicit define the type of the payload variables, you can use CAST function like this.
SELECT CAST(state.reported.number AS DECIMAL) AS digits,
CAST((state.reported.name) AS STRING ) AS name
FROM '$aws/things/WebHMI_Dnipro_1/shadow/update'
 As it is tested, let's get use of the data by guiding them to IoT Analytics. Click one more time at “Add action” button.
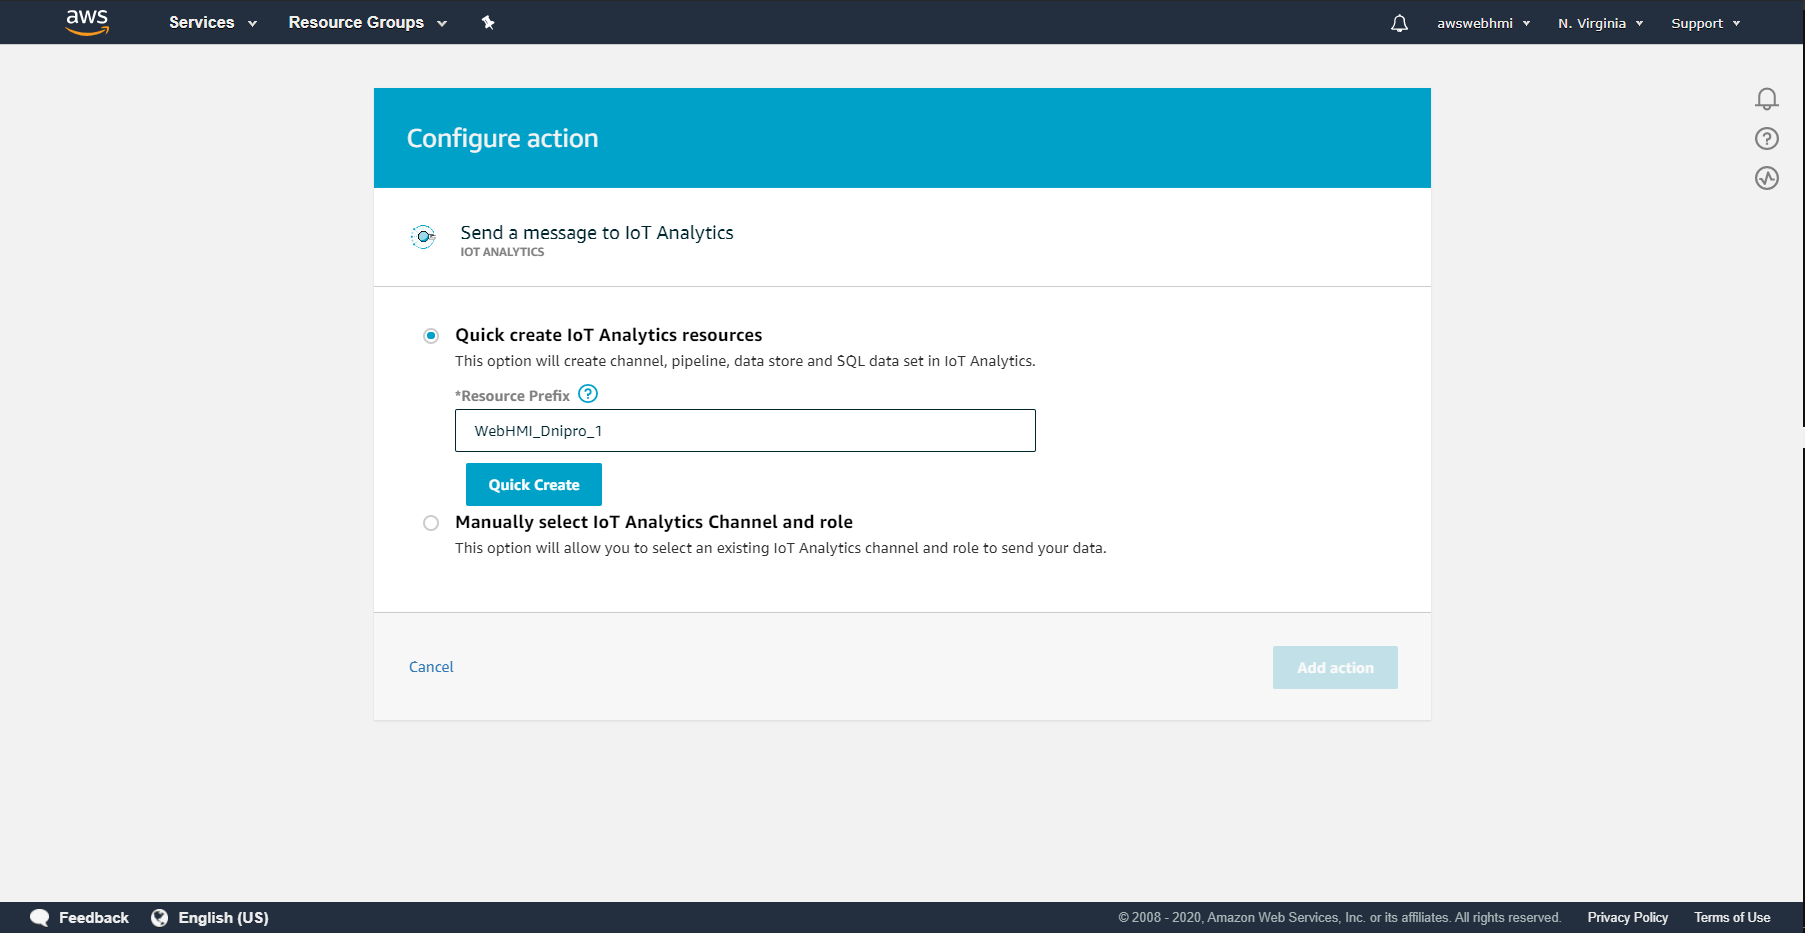
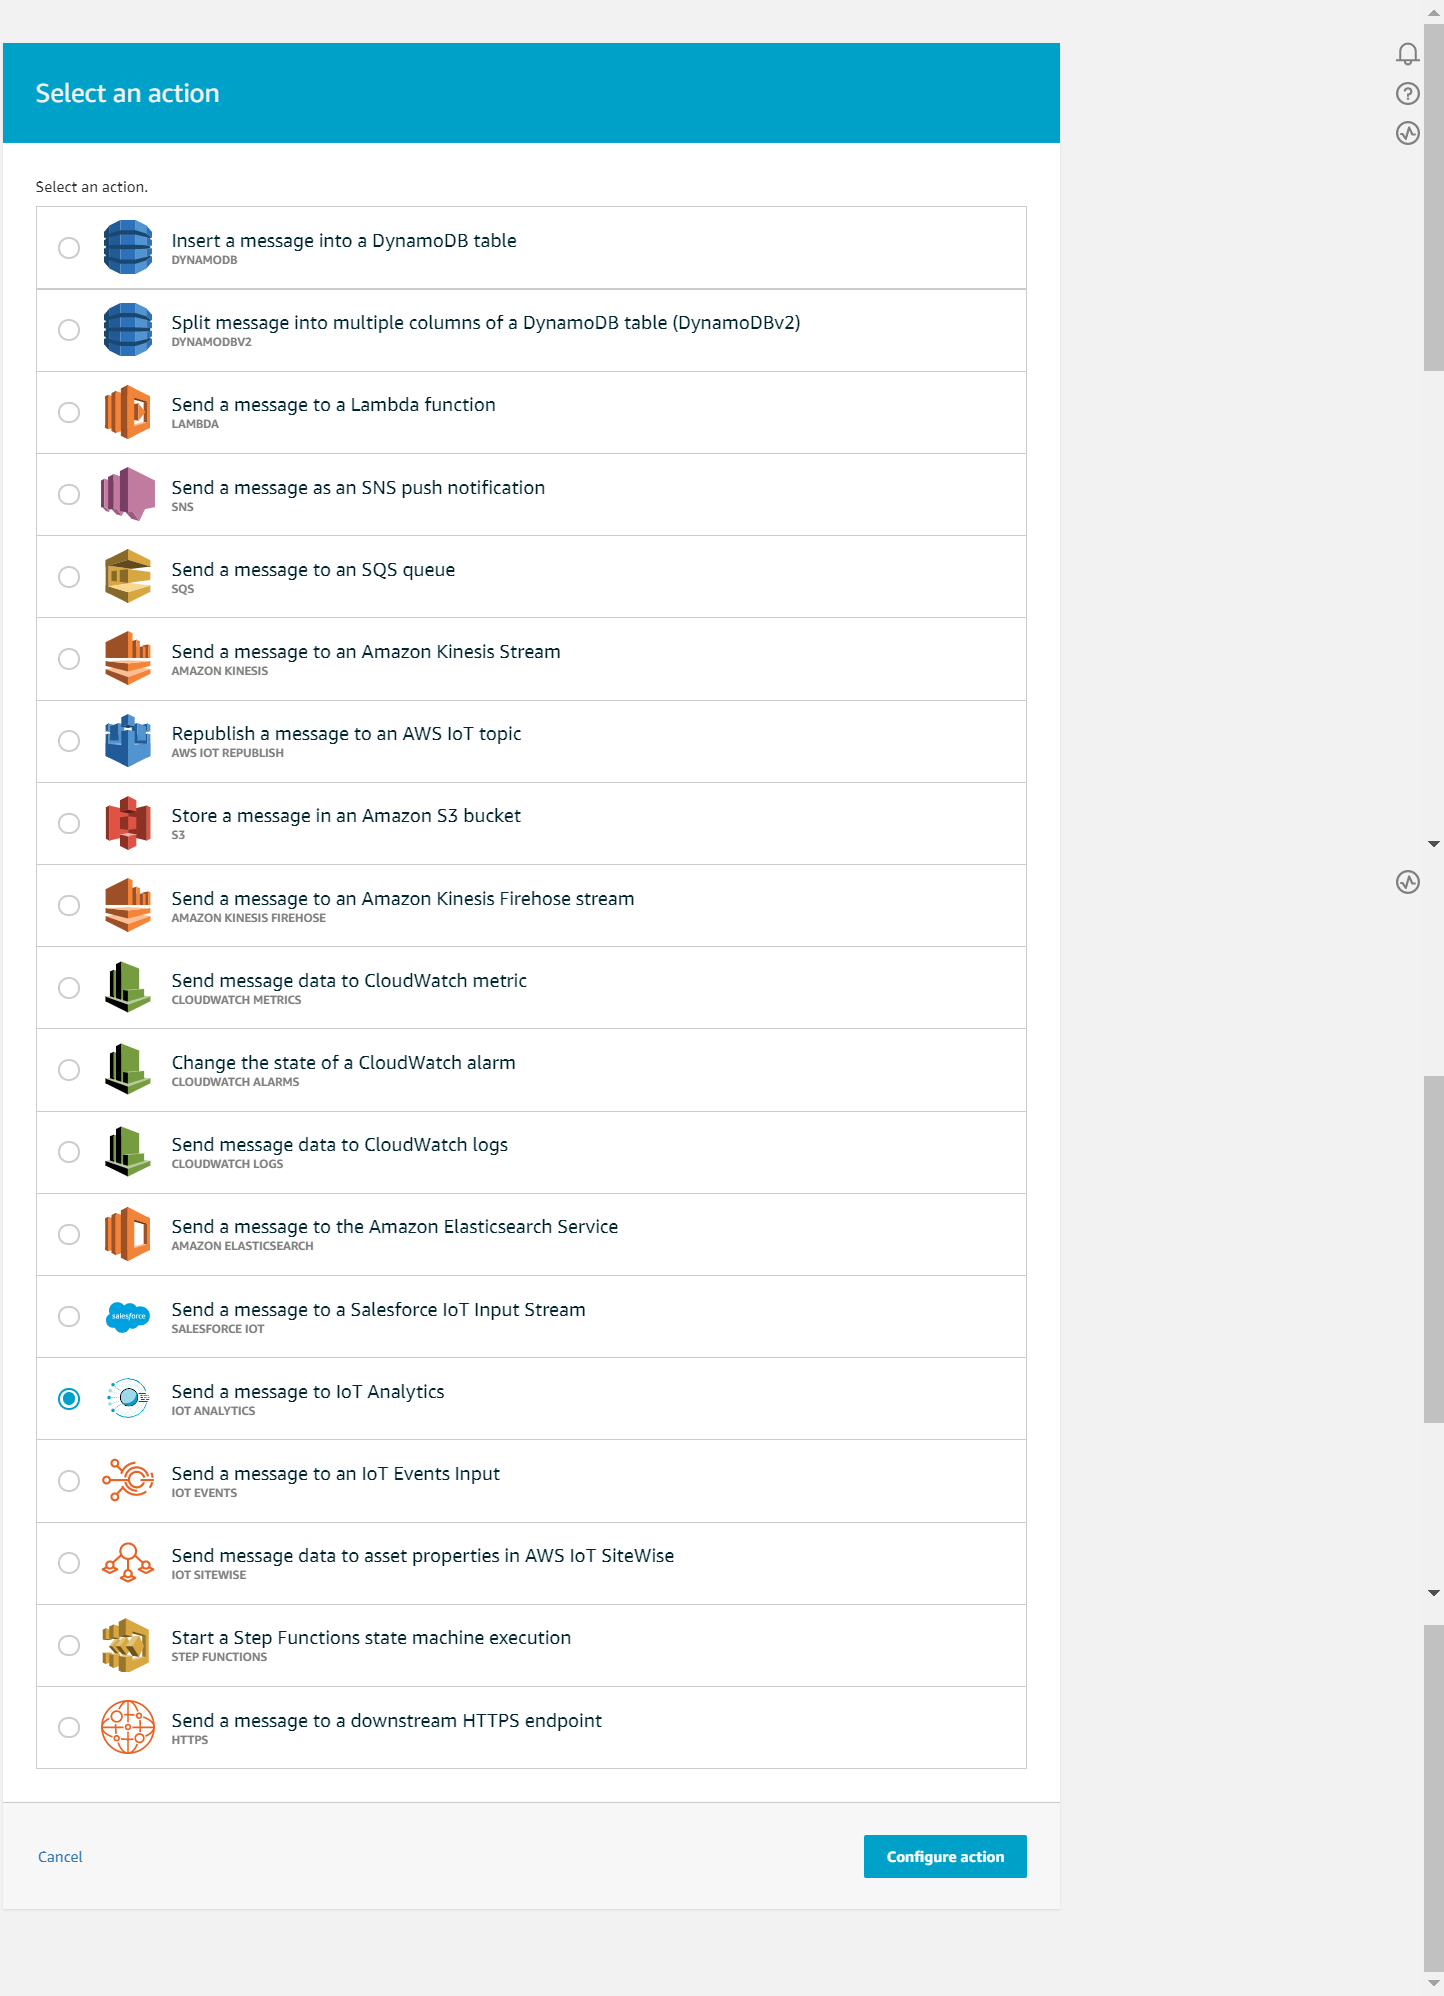 Select “Quick create IoT Analytics recouses”. Fill in the prefix, which will describe either you rule or the Thing to which that rule is applied.
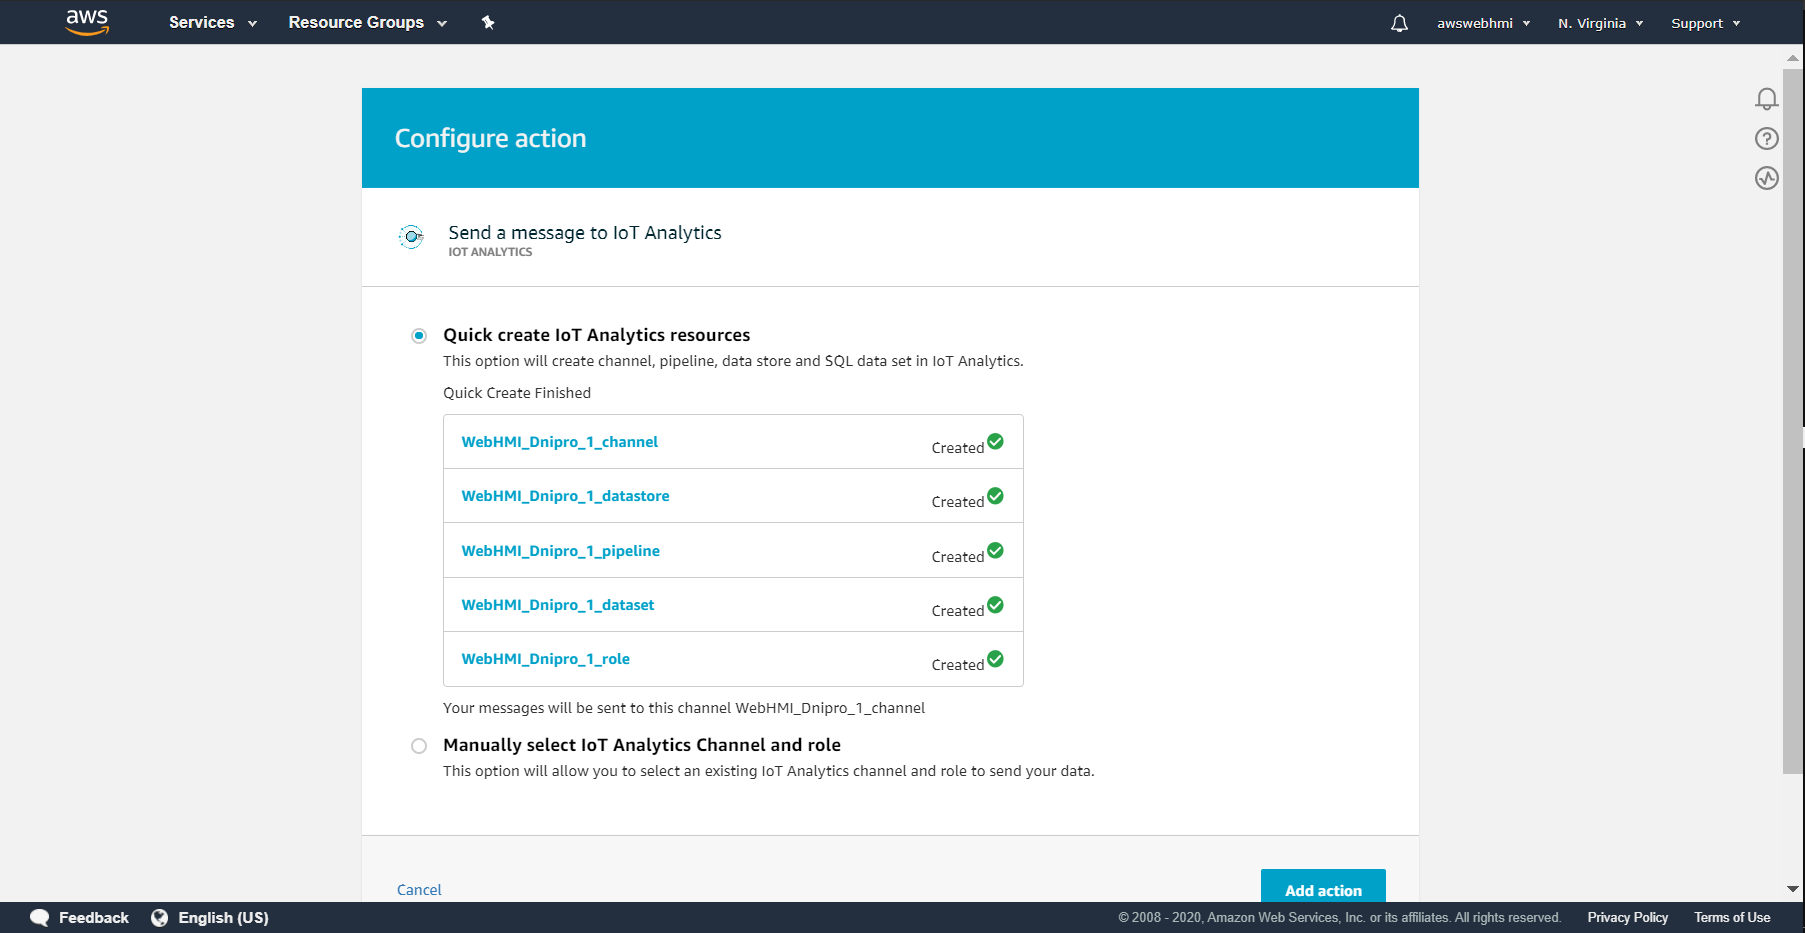
 By clicking at “Quick create” you will see that it is done so that you are can click “Add action”.
From that time, when the action is added, all the new data that comply with the SQL rule query condition, will be guided to IoT Analytics, so it would be possible to visualise it.
Let's post something to …/update topic just to fill in the sample data into IoT Analytics service.
To do this, go to IoT Core Test MQTT Client and publish yet another message, that are valid, which will not go to “error actions” branch of the rule if you setting up the analytics to “Actions” branch and vice versa if “Error Action” branch.
When it is done, open the IoT Analytics service and interact with data.
Click “New Analysis button” in the top-left corner.
 Then click “New data set”.
 Pick the “AWS IoT Analytics” new dataset data source.
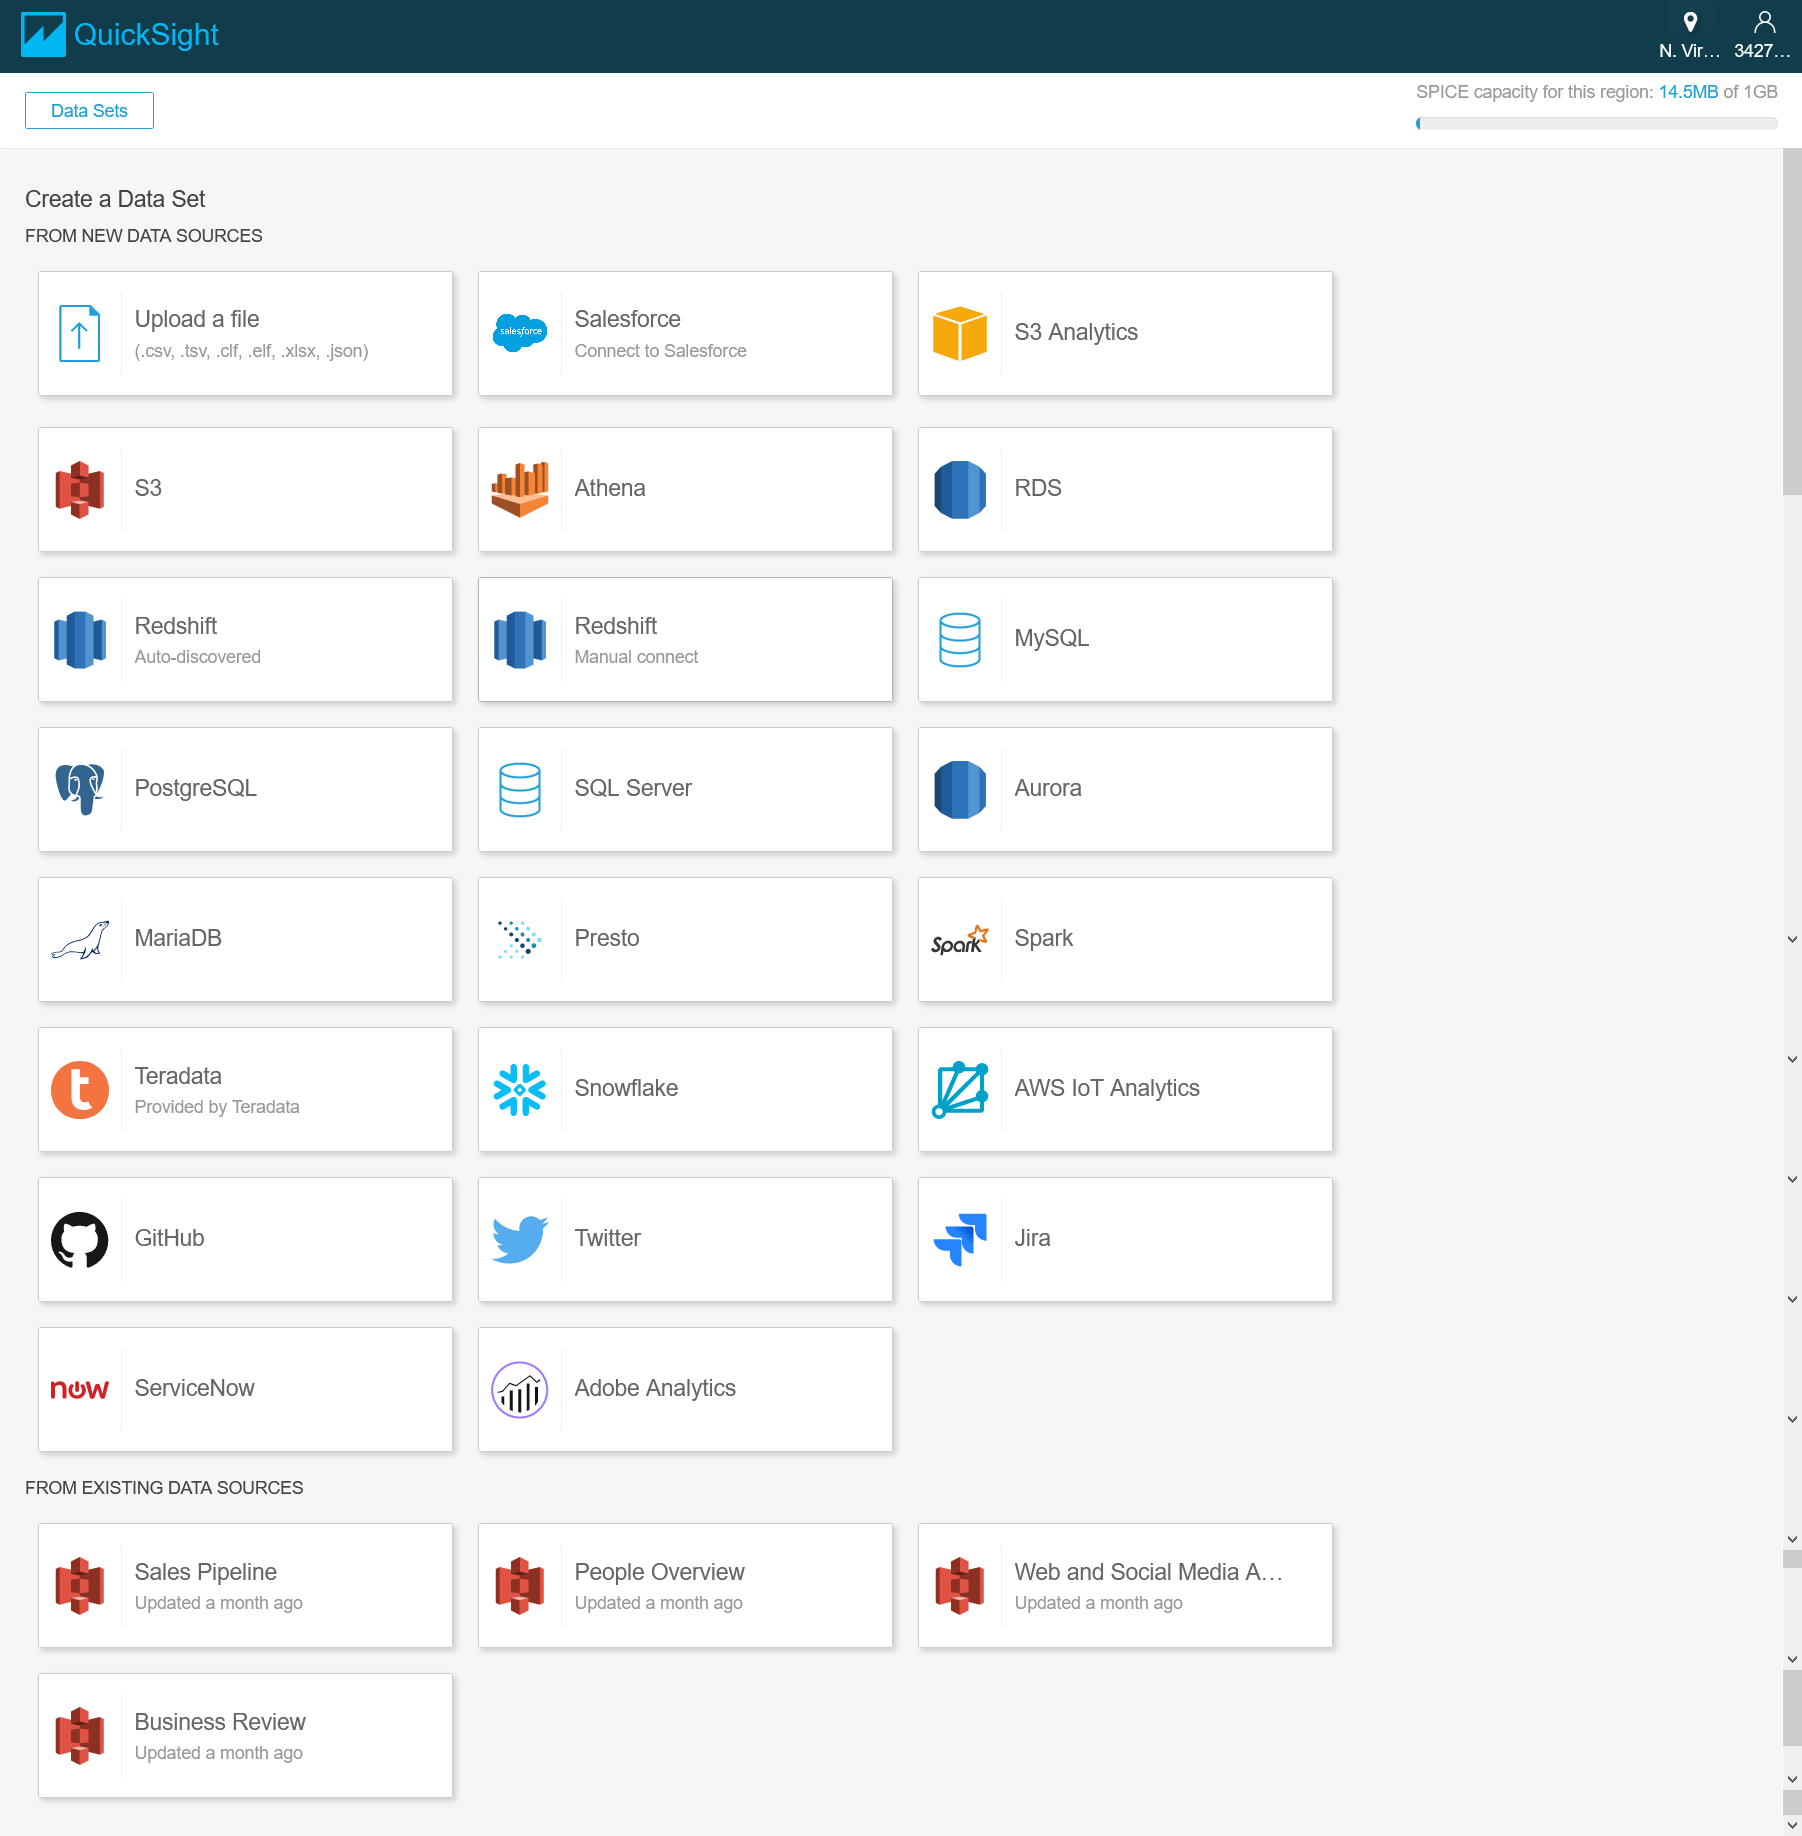 If it is the same with IoT Core region, such as USA, N.Virginia. (US-East-1) which is are free region at the time of writing, you will see that there is one source ready to import. Put the radio button and click “Create data source”.

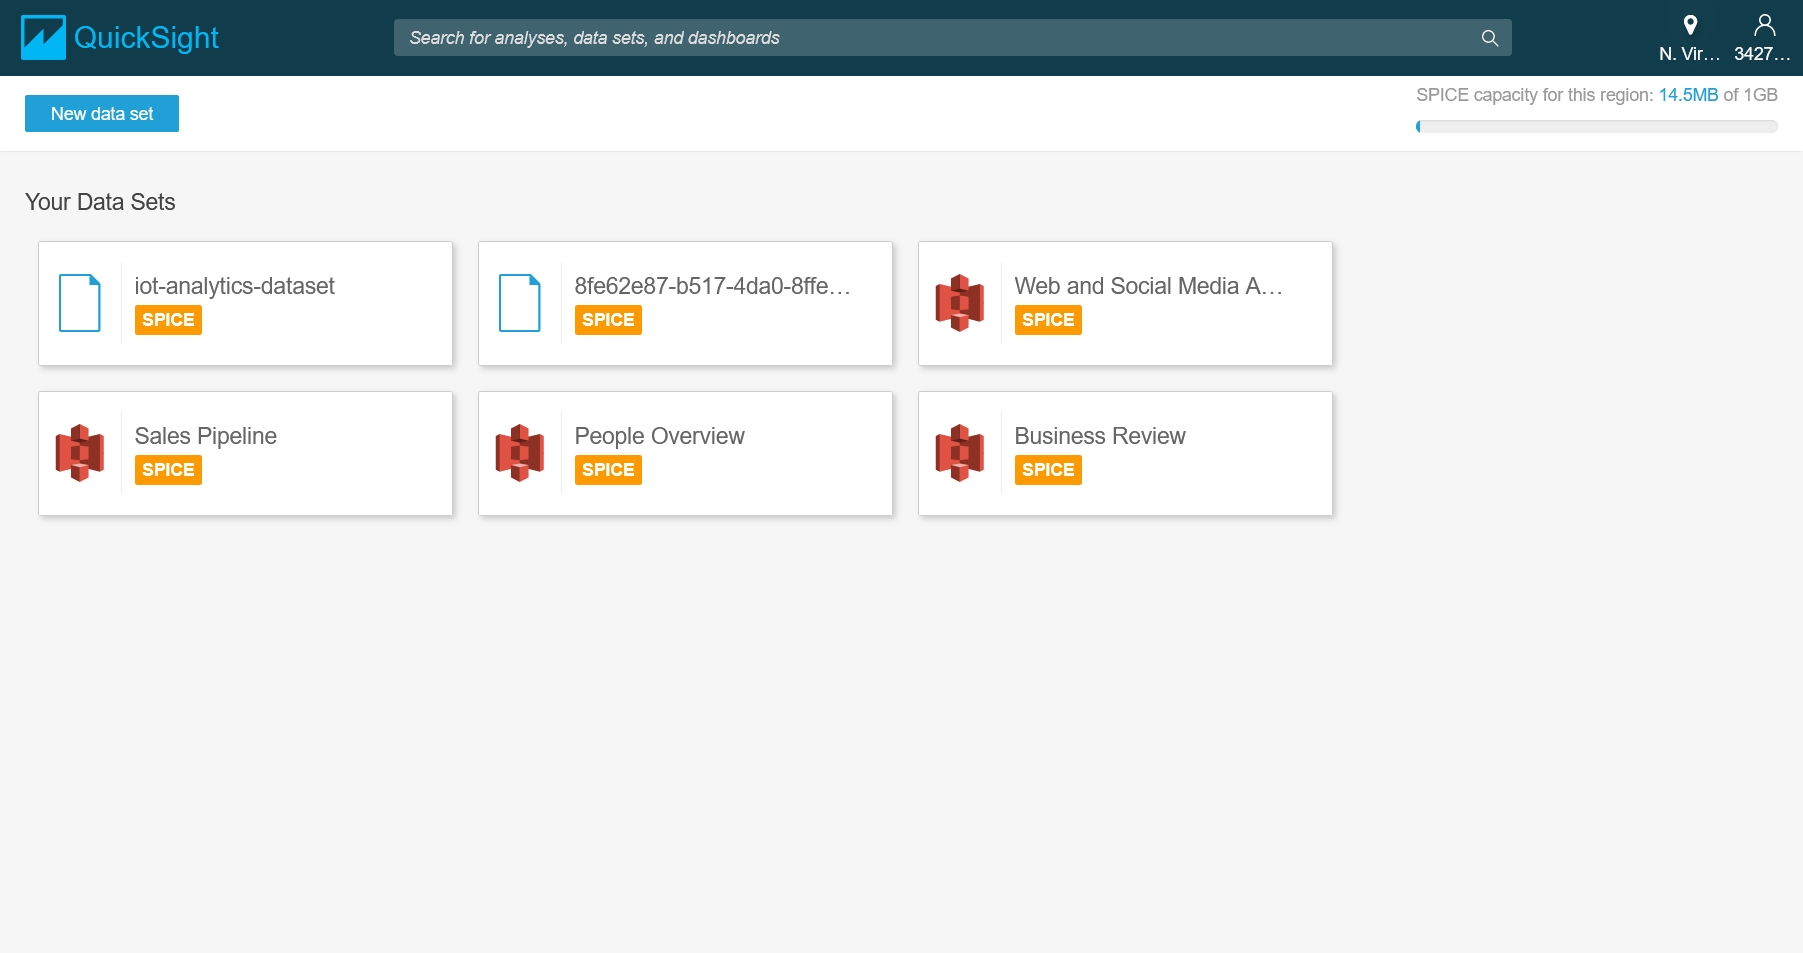
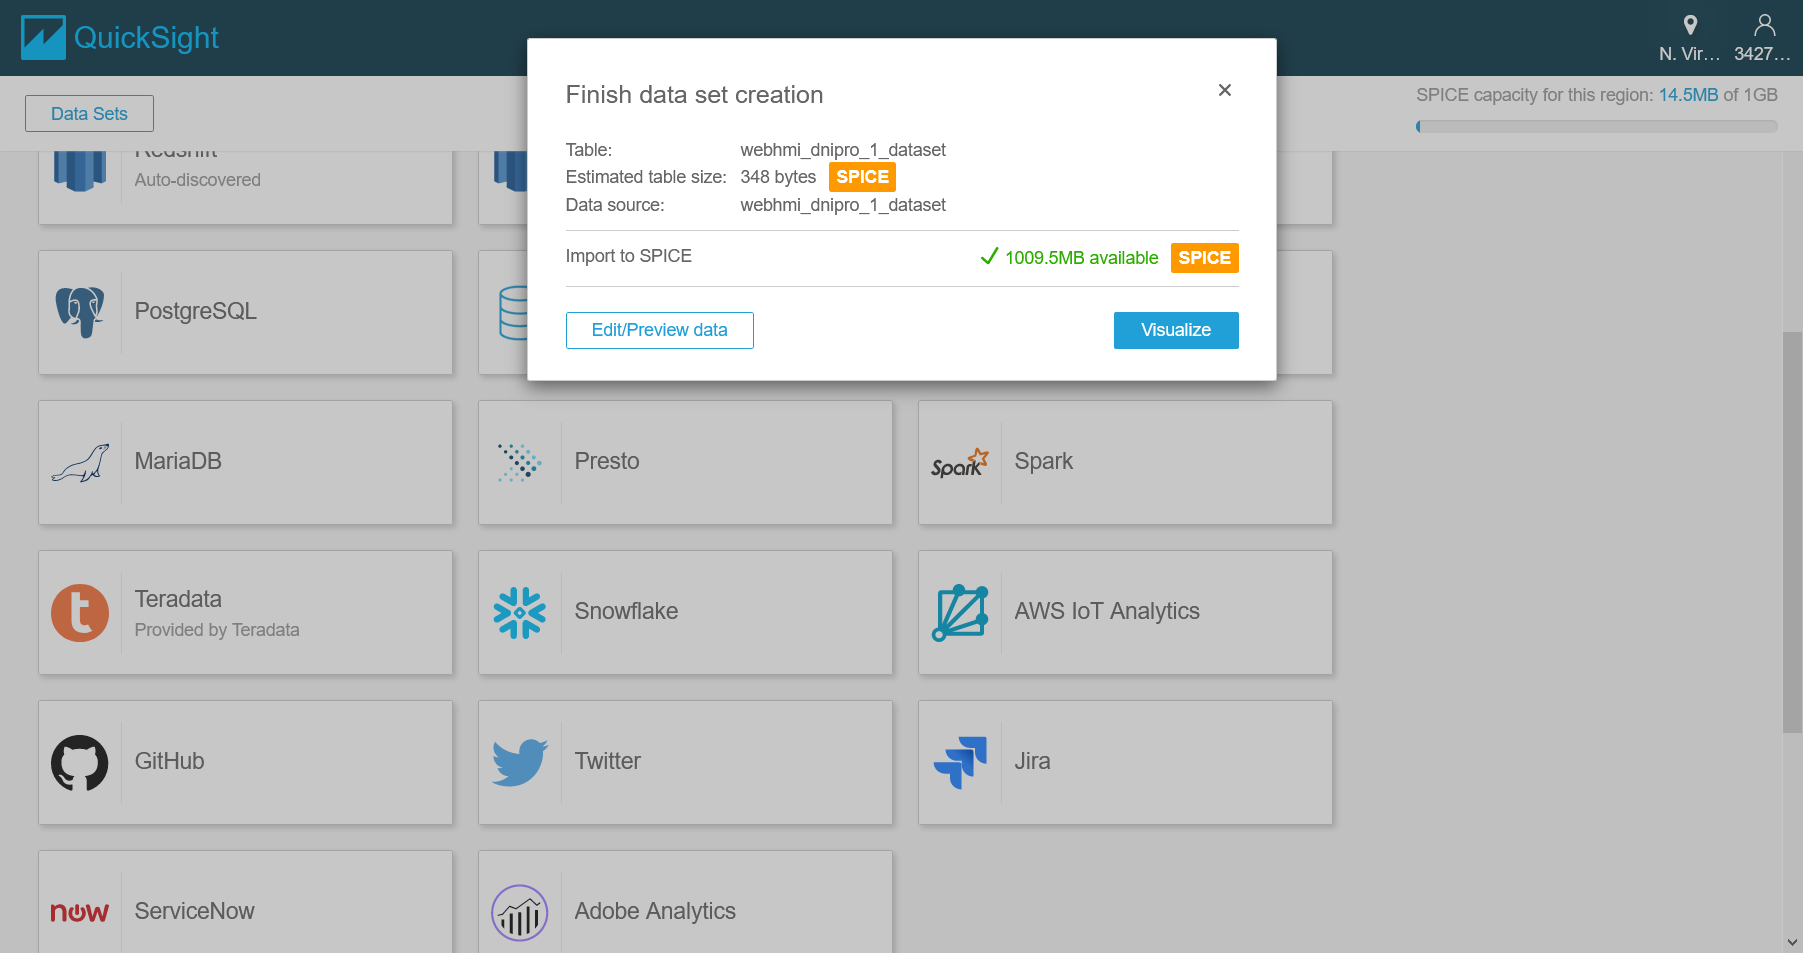
The next step will indicate how much storage is available. For the first time it is near 1 GB SPICE (disk quota) available. Click “Visualize”.
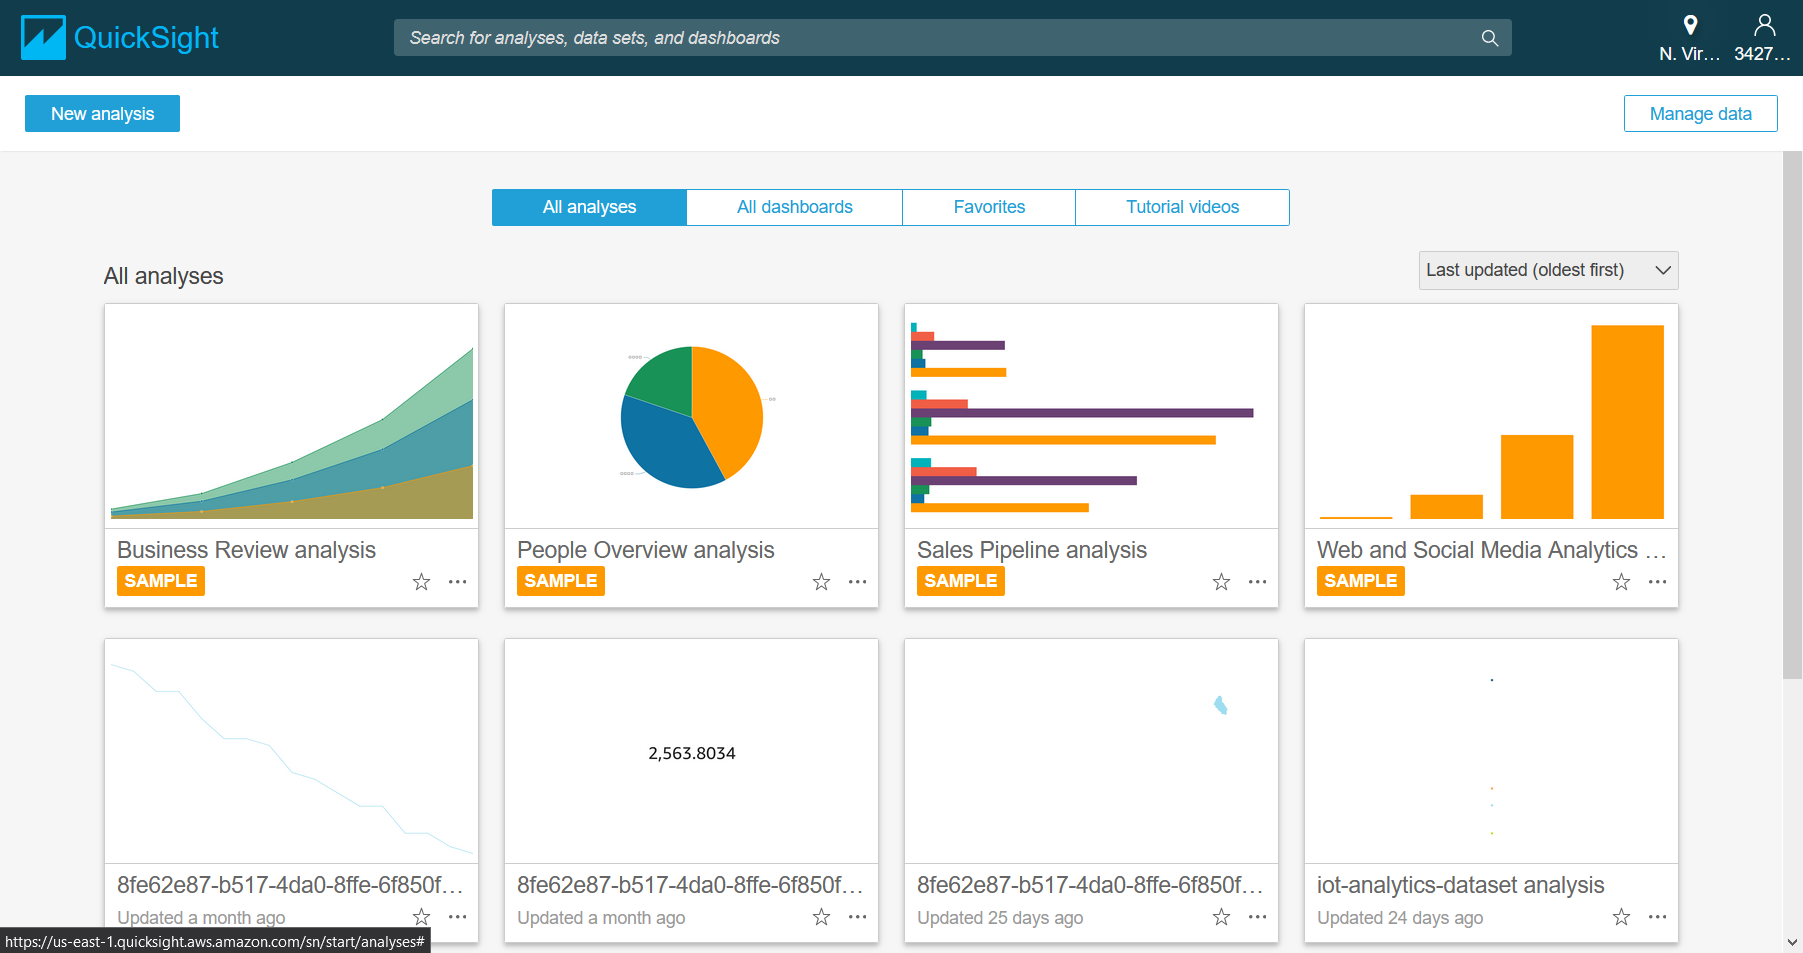
 It is possible to create a various visualisation of your data. Look at the sample dashboard.
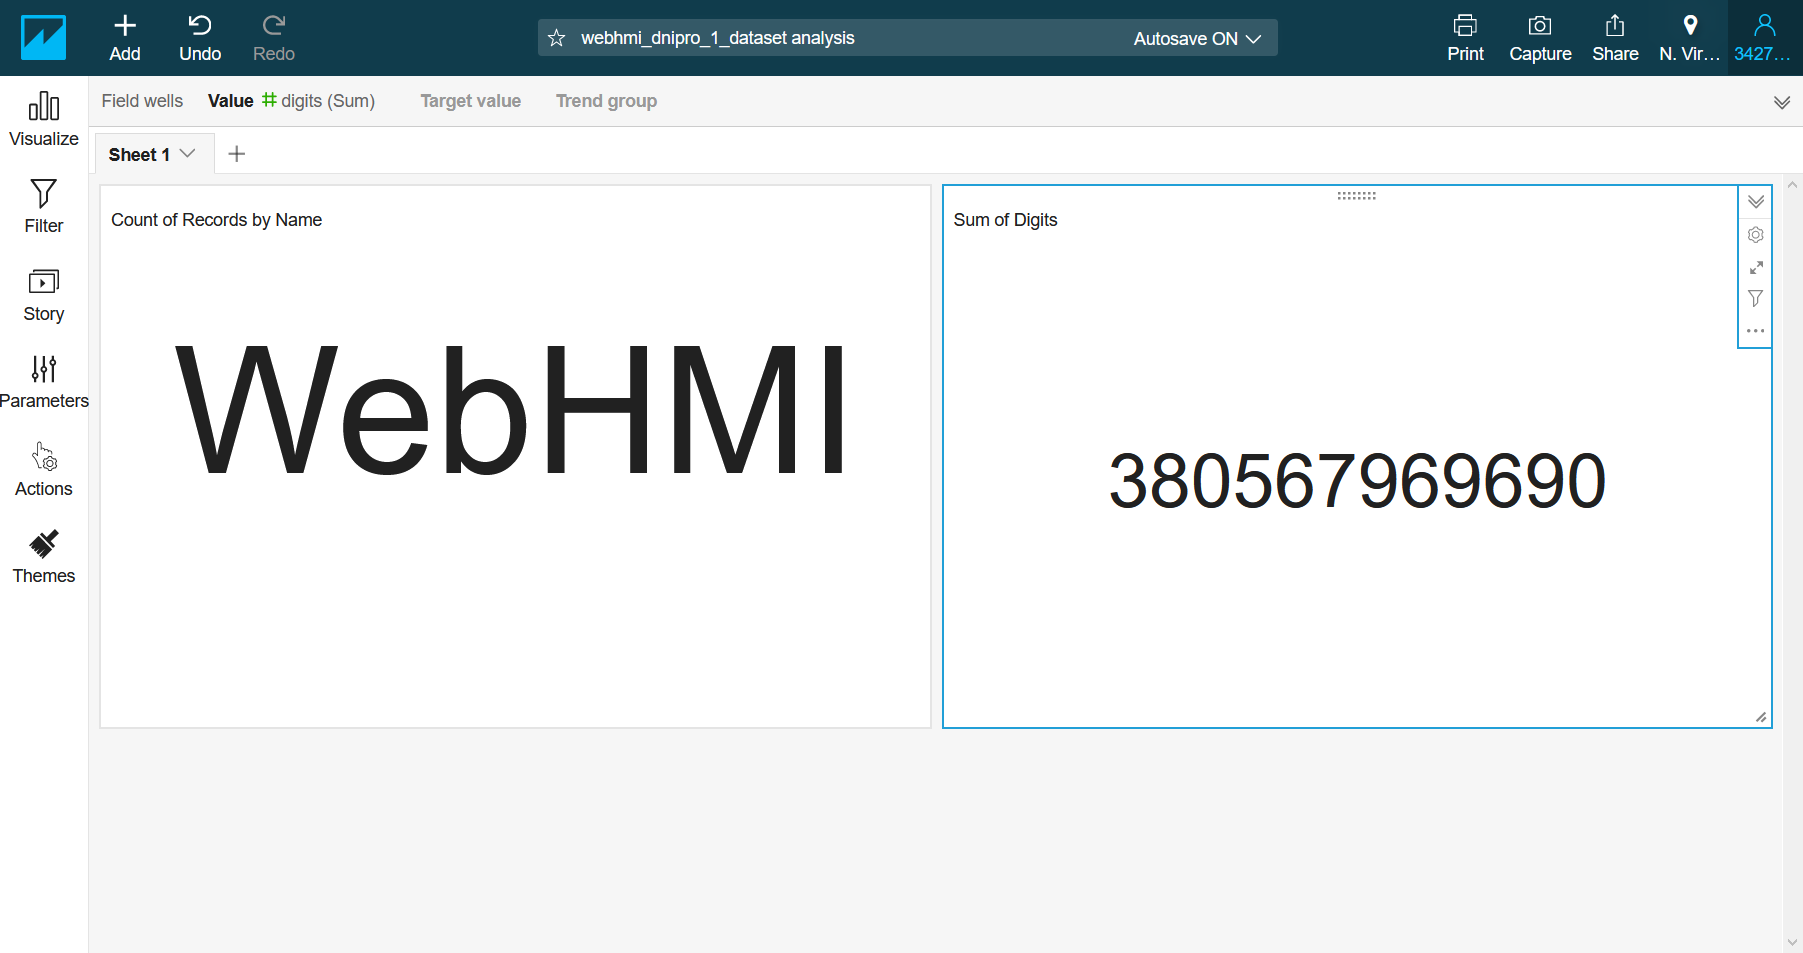
At that point, you can visualize the data from any reporting Thing.
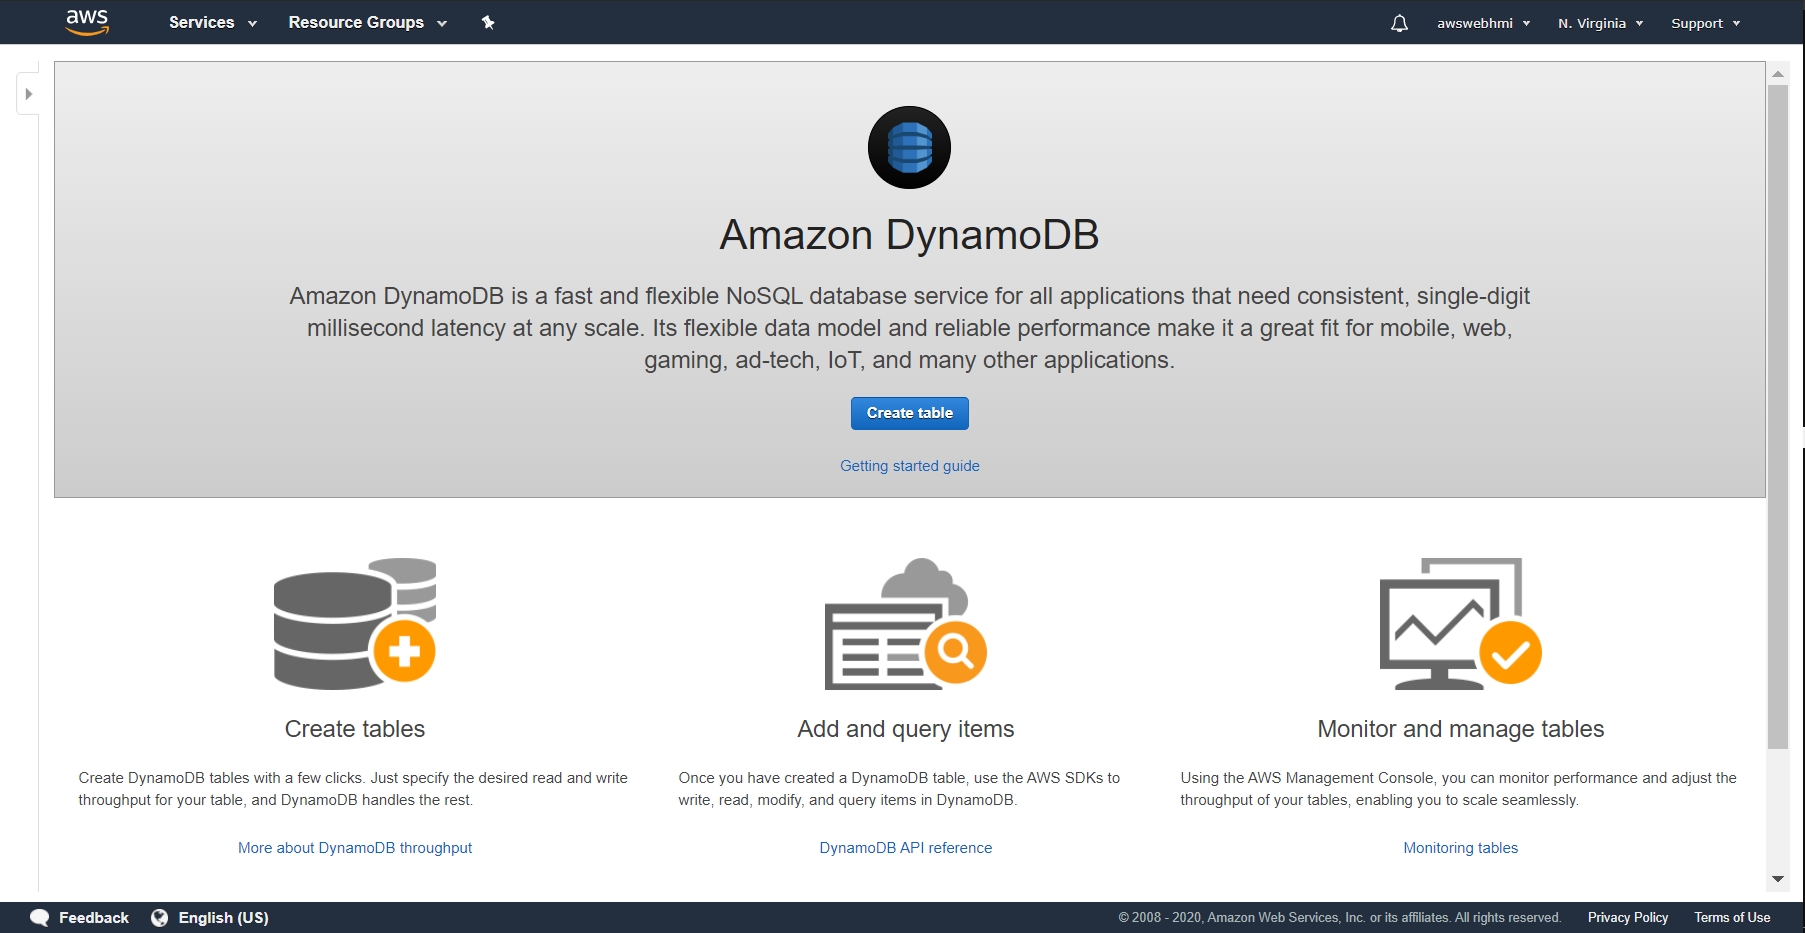
DDB
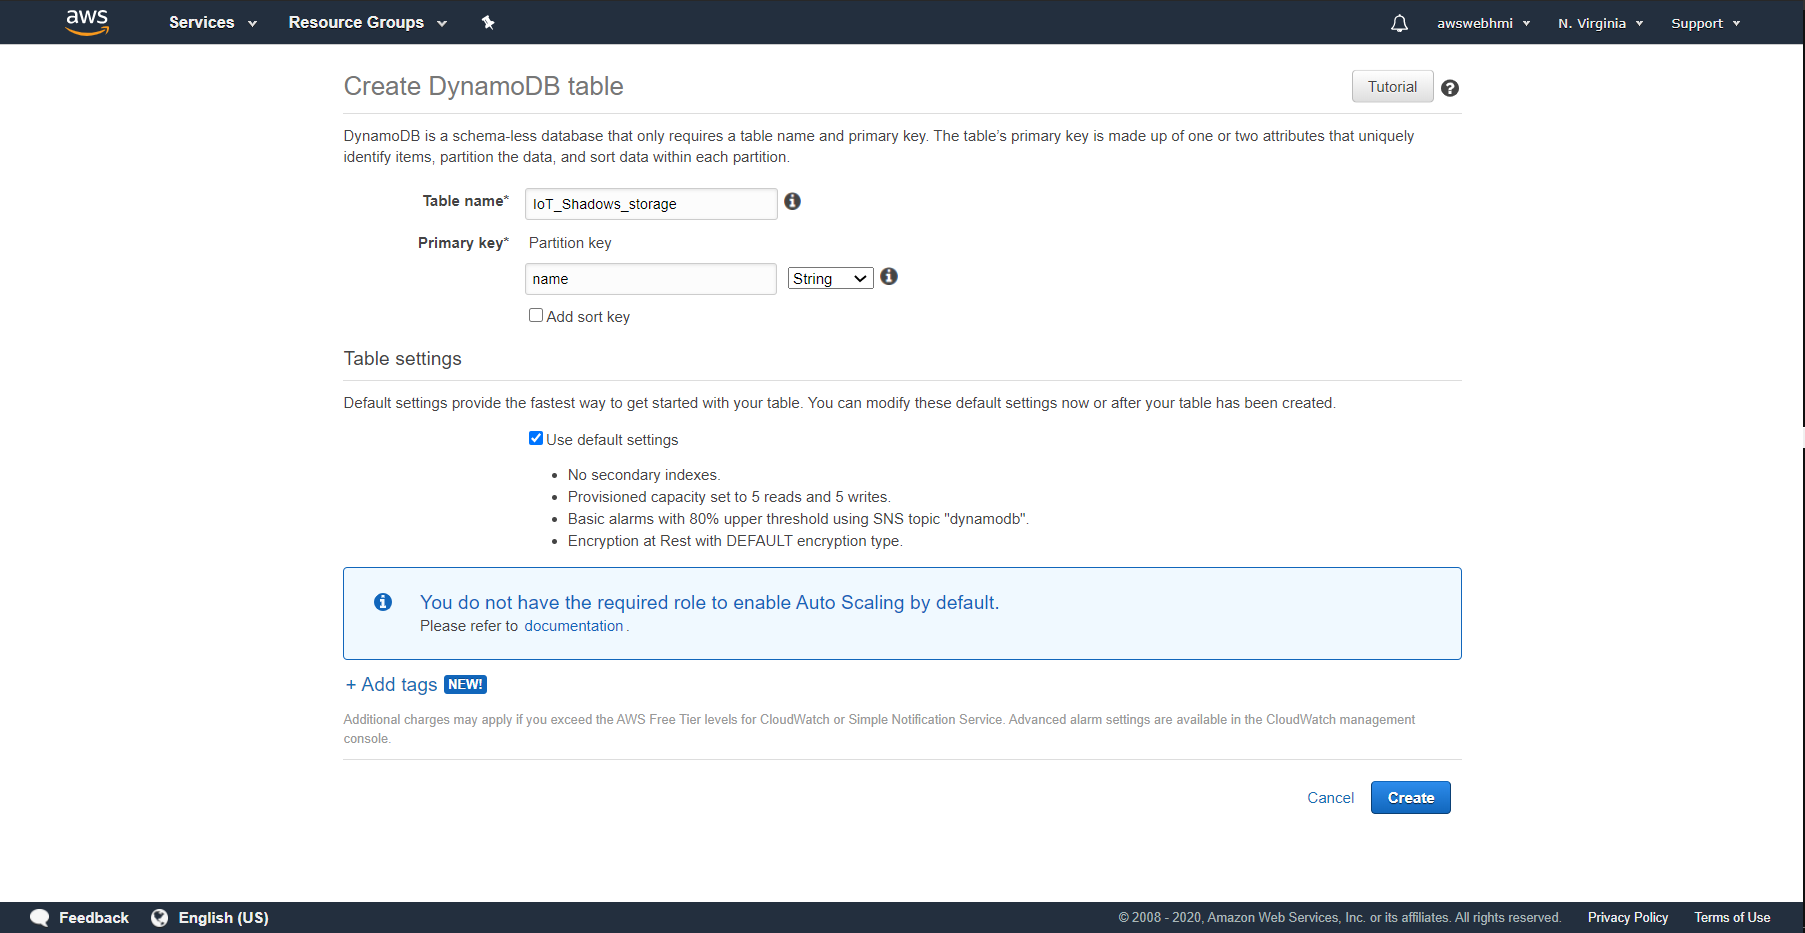
To store the data and be able to query it, you would like to pull in the database. There is AWS DynamoDB integrated for that purpose. Let's create a blank table.
 It is primary key notion. It is like the main column in the table. The best practise it is SQL-timestamp-formatted-string with timestamp use as primary key.
As we do not have the timestamp in the sample data, the name will be used.
It is primary key notion. It is like the main column in the table. The best practise it is SQL-timestamp-formatted-string with timestamp use as primary key.
As we do not have the timestamp in the sample data, the name will be used.
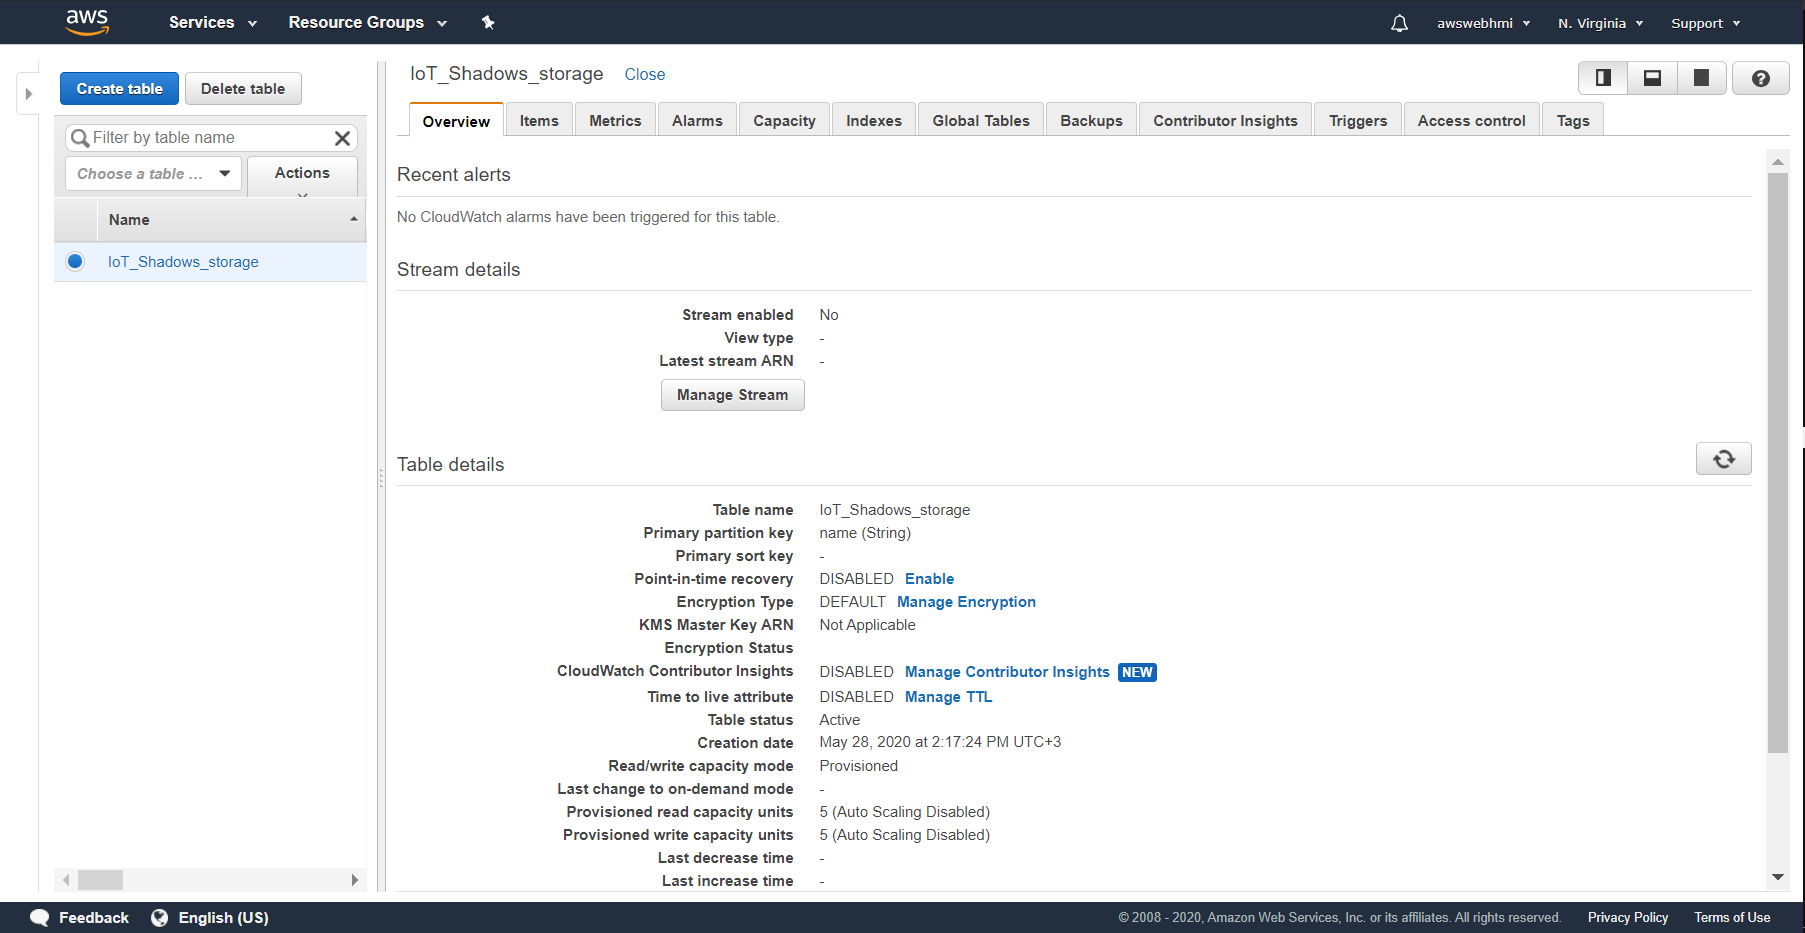
 This is the blank table. There is no any Items yet.
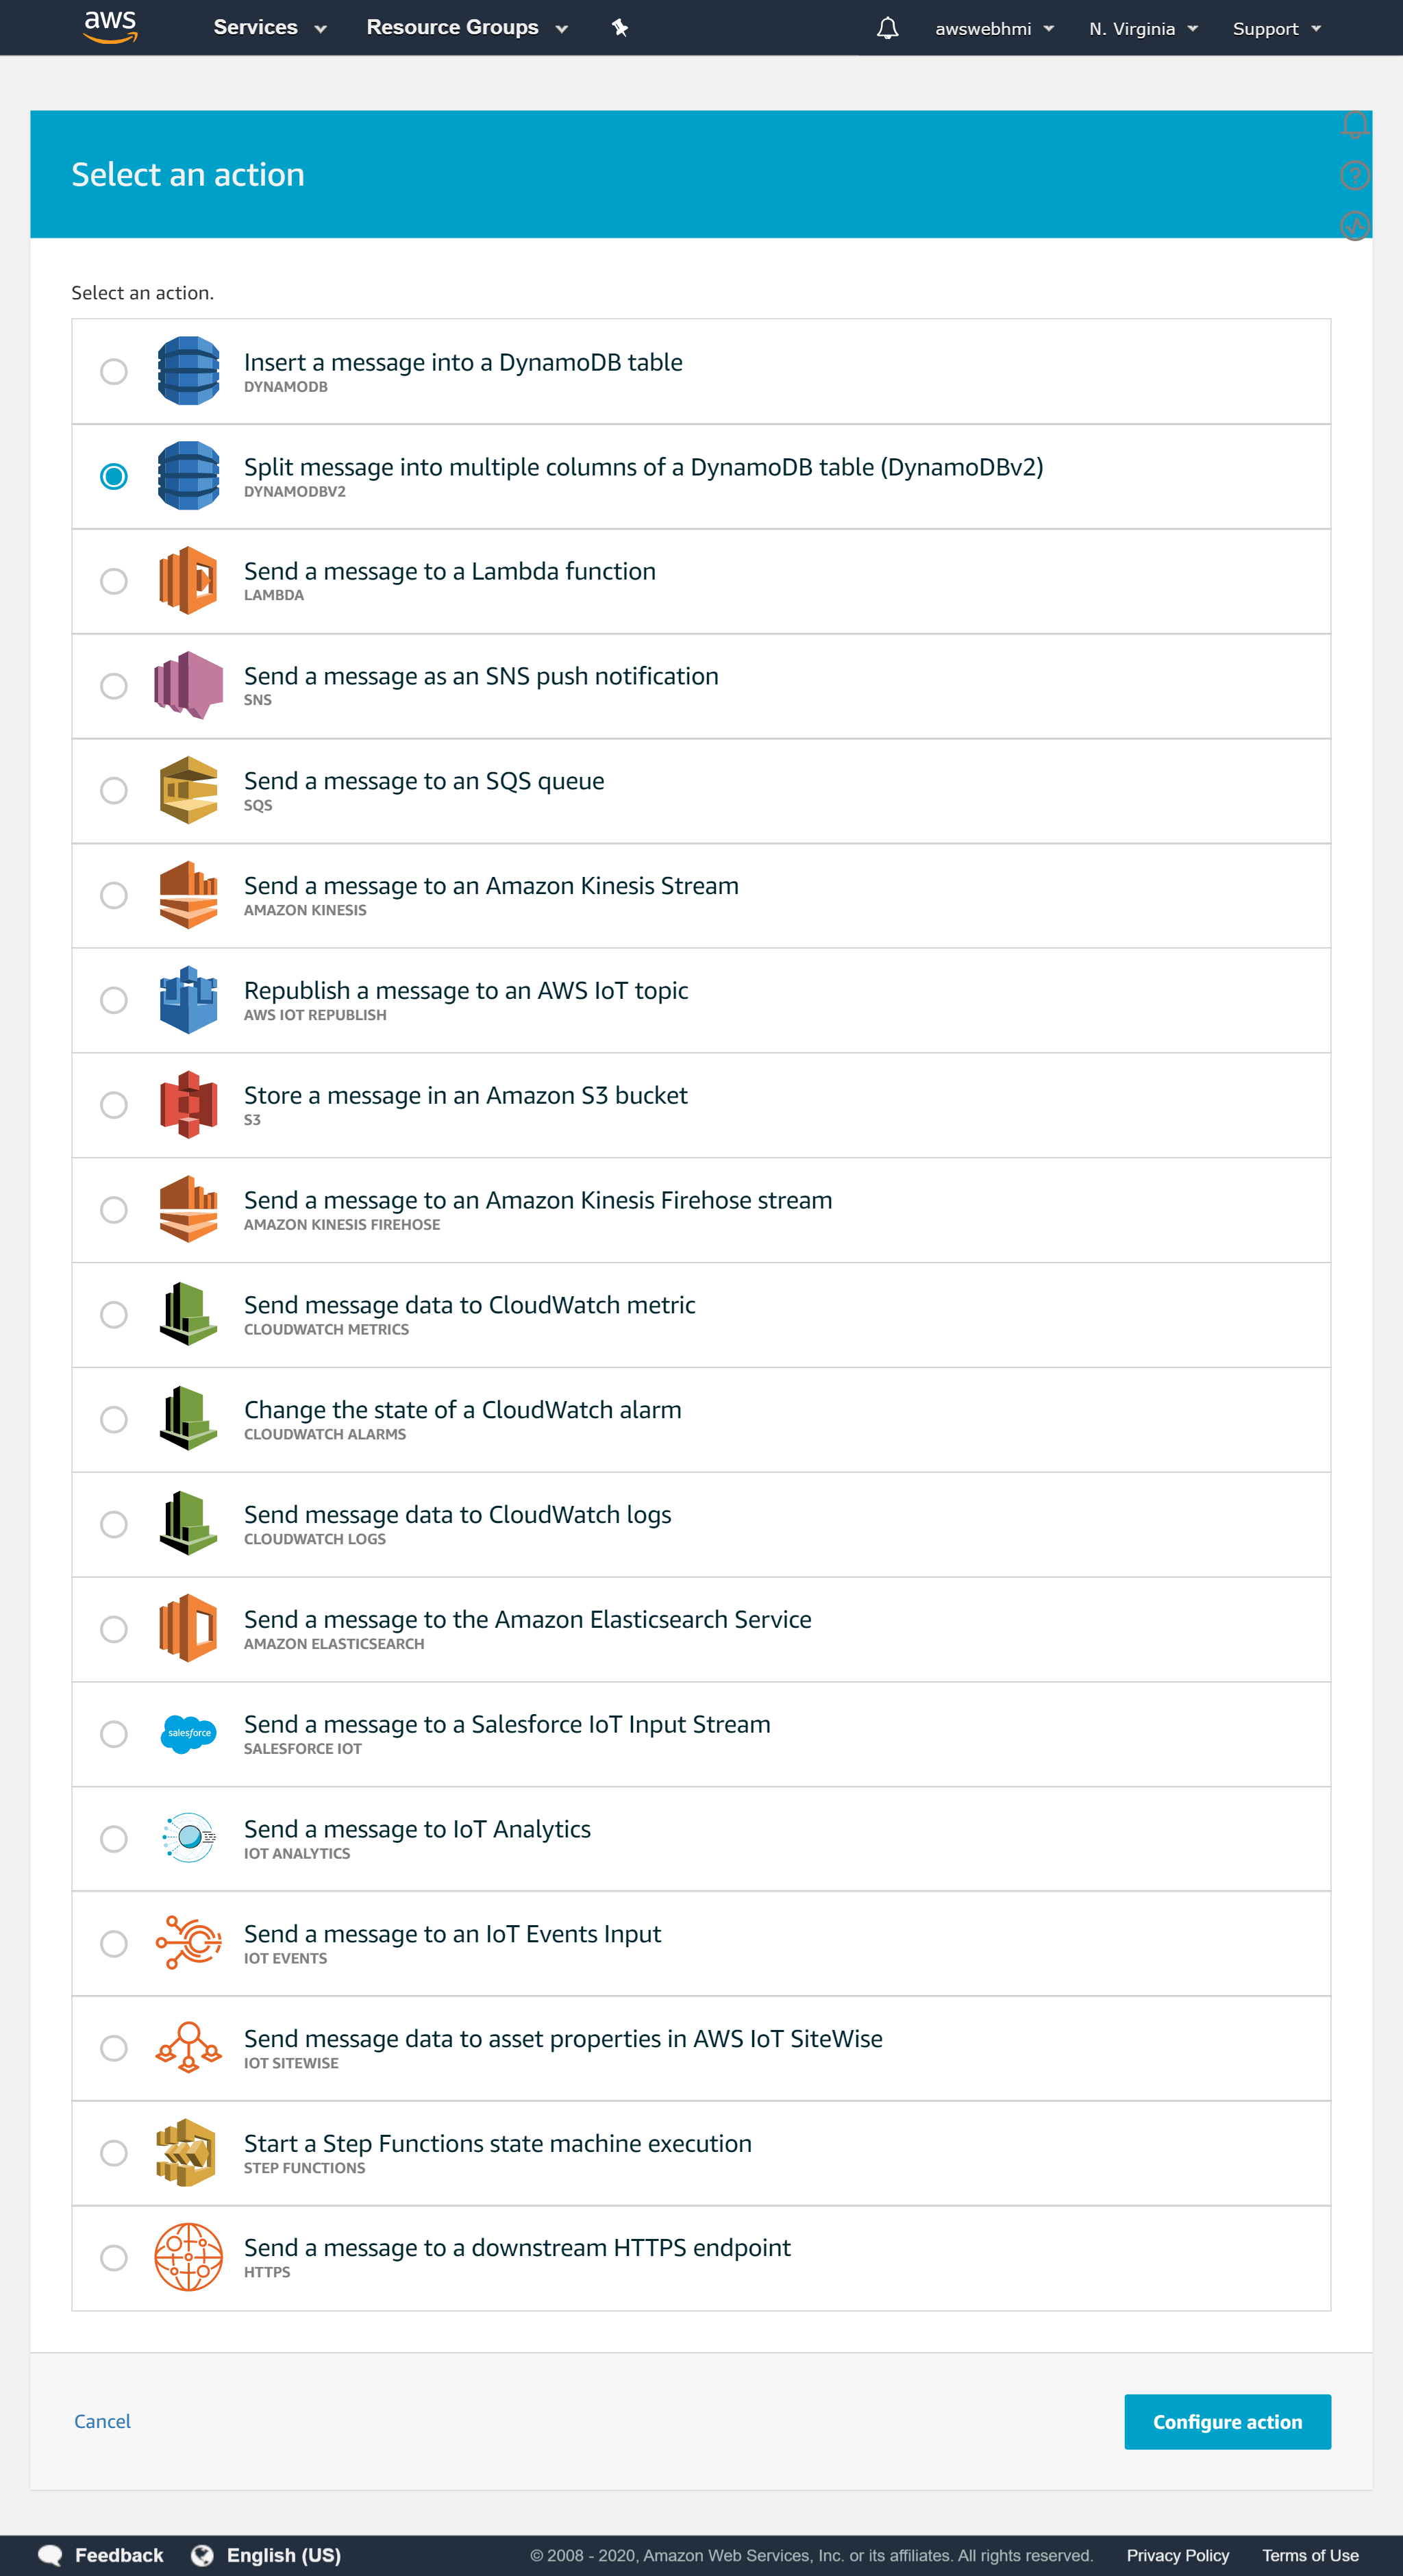
 Let's guide some data to DynamoDB. Go back to the Rule and “Add action” to it, with “Split message into multiply columns of a DynamoDB table (DynamoDBv2)“.
 Fill in the name, select Role and click “Update Role”. The green label will indicate that everything is fine and IAM configured well.
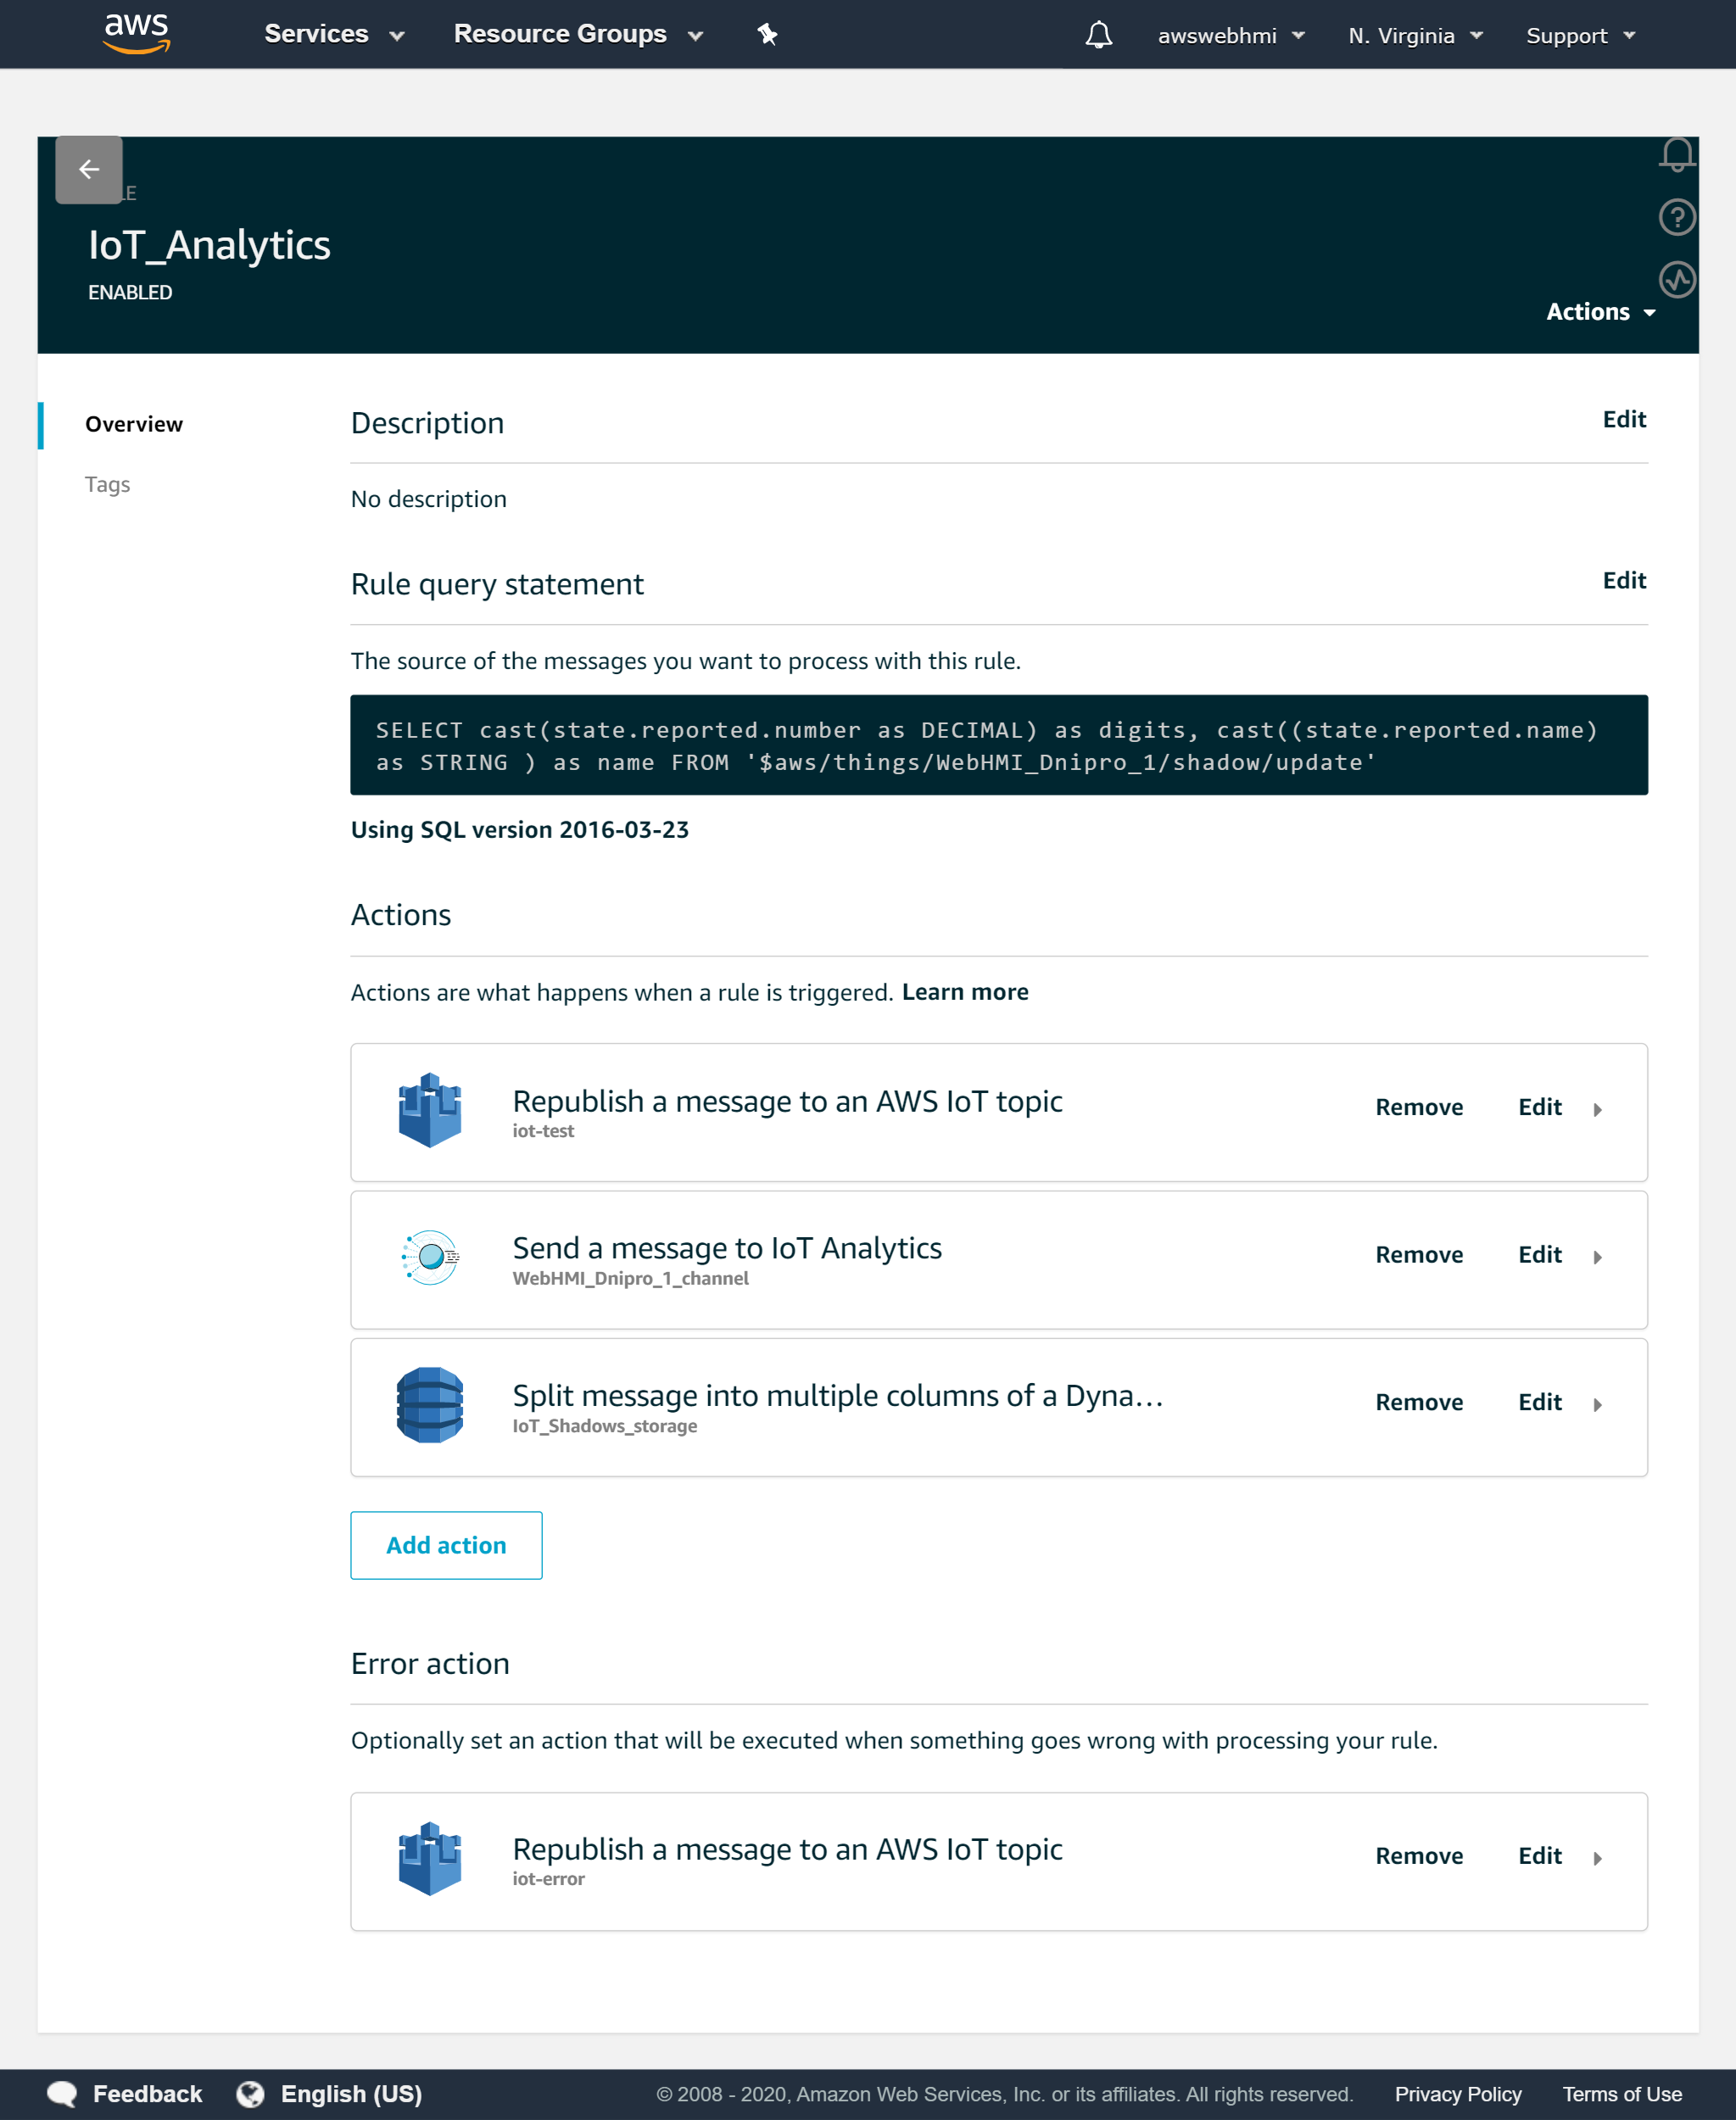
 The Rule should look like this.
 This time, you can practice to post message through MQTT.fx or use AWS MQTT Client as you wish. The MQTT.fx client will be considered below.
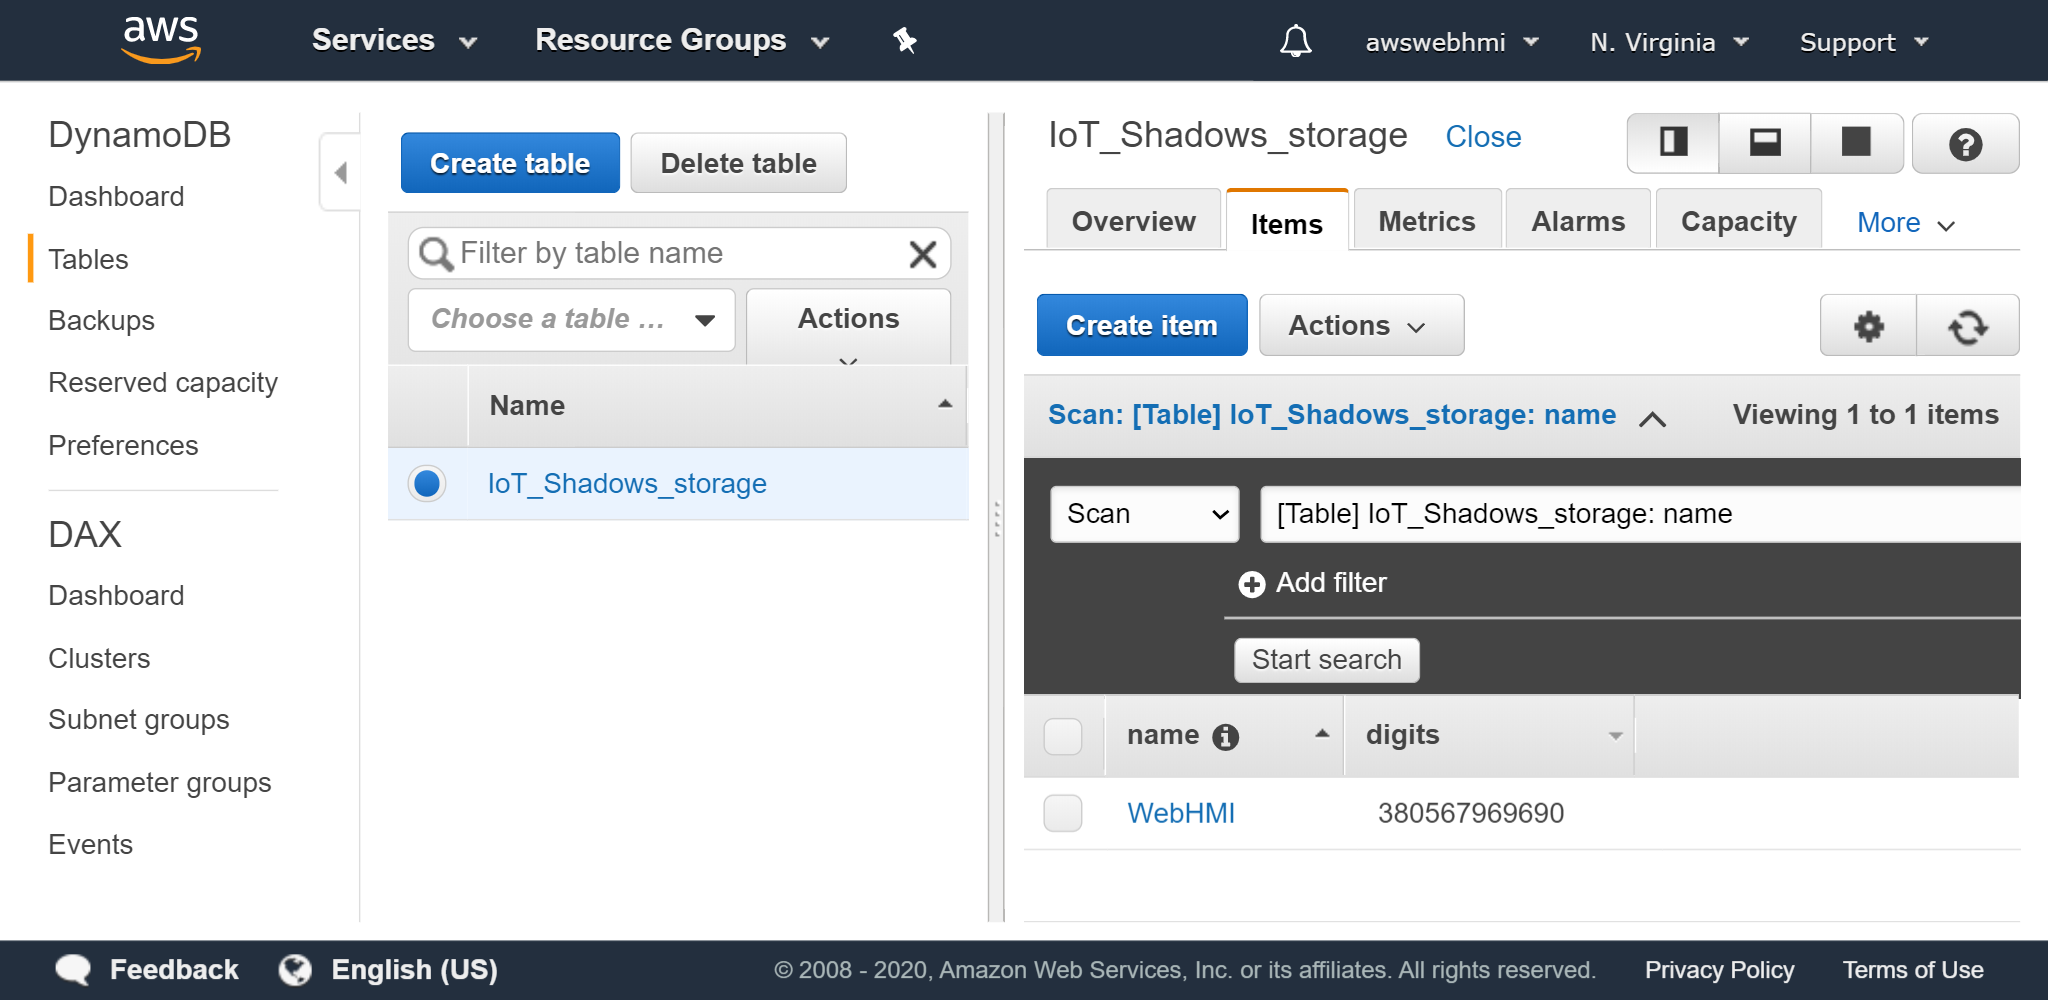
 In the final, you will see that you data appear in the your Table in Items tab, if everything is configured well.
 Otherwise, you will see the
 …/update/rejected reported an error with caused reason. That will help you to diagnose the problem and fix it.
Configure WebHMI
There is a WebHMI as MQTT Client considered here. The only difference is the Broker's settings, that time you need to connect to AWS and identification is related to certificates also. Be sure that your bunch of certificate files are valid and binded to your Thing in AWS, to test it using MQTT.fx is highly recommended.
The first thing is to create connection to AWS MQTT Broker. Click at “New connection”.
 Firstly select the “Device model: MQTT”.
Fill in the “Device address” from IoT Core Interact menu and 8883 port accoiding to AWS Developer Guide
Firstly select the “Device model: MQTT”.
Fill in the “Device address” from IoT Core Interact menu and 8883 port accoiding to AWS Developer Guide
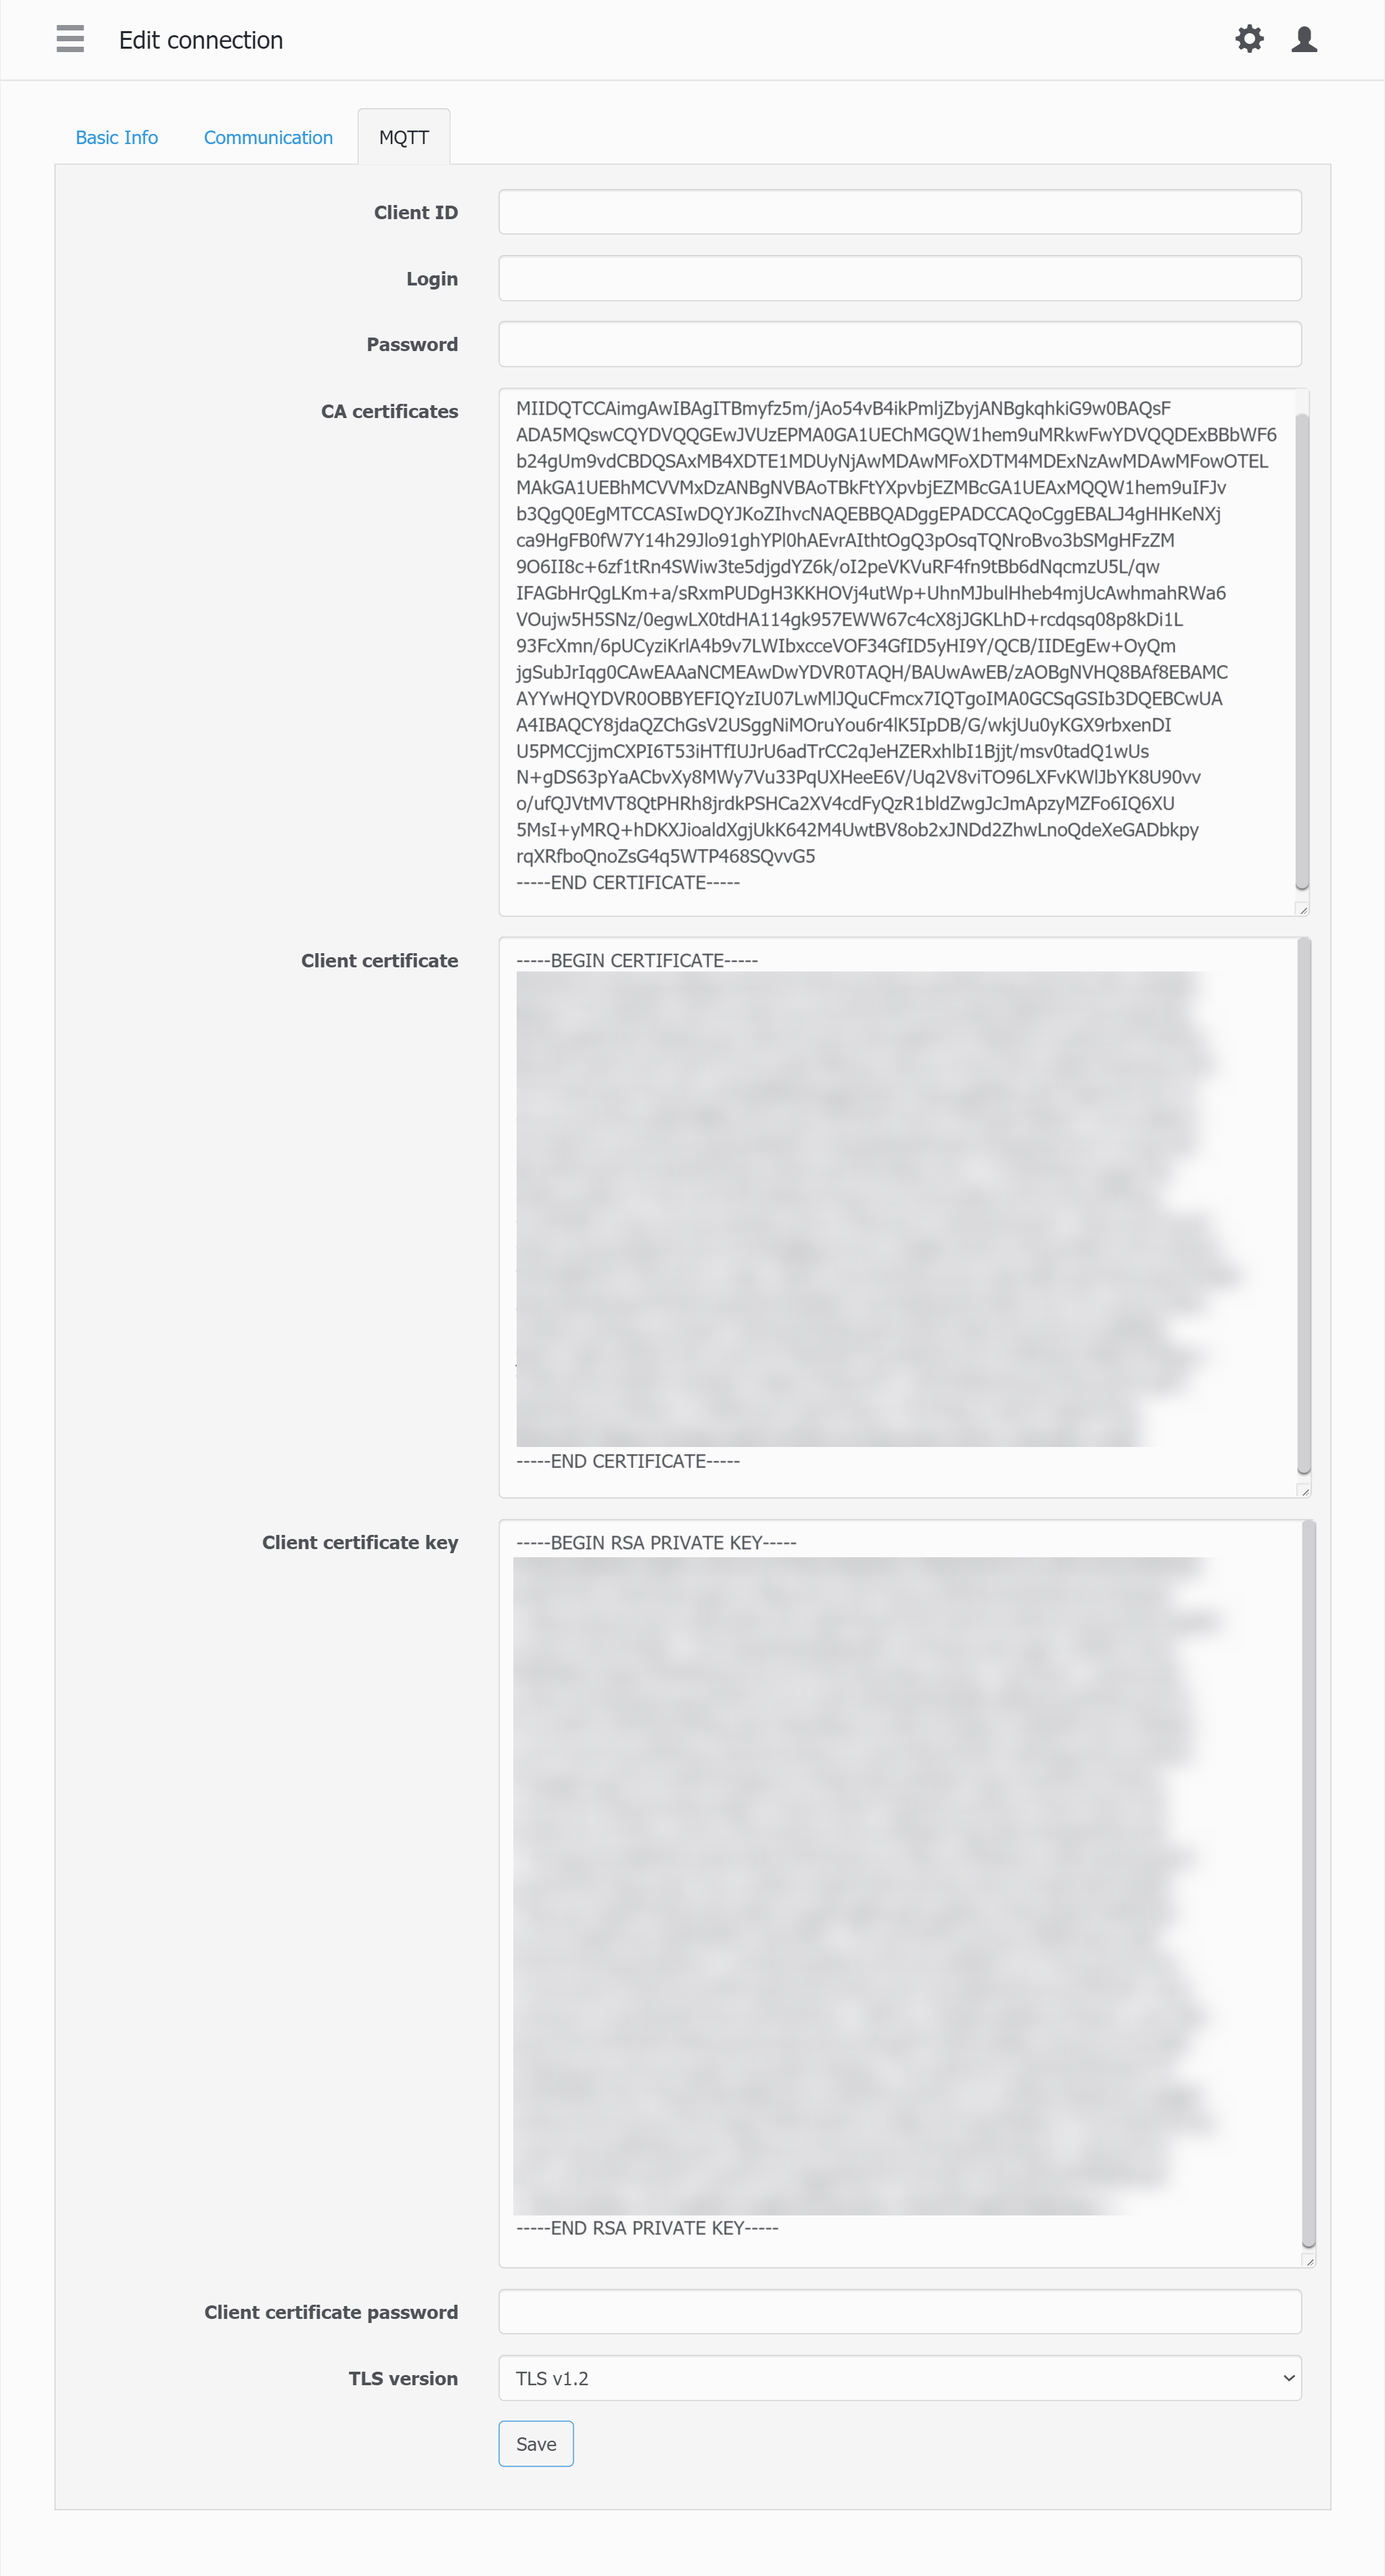
 Go to MQTT tab to copypaste certificates to WebHMI connection settings.
At the moment you should configure MQTT.fx to work with AWS IoT Core Thing's Shadow. So, you have all files downloaded such as .pem and .crt.
So the task is to copy symbols from files to WebHMI MQTT field using notepad.
Go to MQTT tab to copypaste certificates to WebHMI connection settings.
At the moment you should configure MQTT.fx to work with AWS IoT Core Thing's Shadow. So, you have all files downloaded such as .pem and .crt.
So the task is to copy symbols from files to WebHMI MQTT field using notepad.
CA Certificates is a “AmazonRootCA1.pem”.
Client certificate is a ”…-certificate.pem.crt.txt”.
Client certificate key is a “…-private.pem.key”.
Pick the TSL version v1.2 at the final.
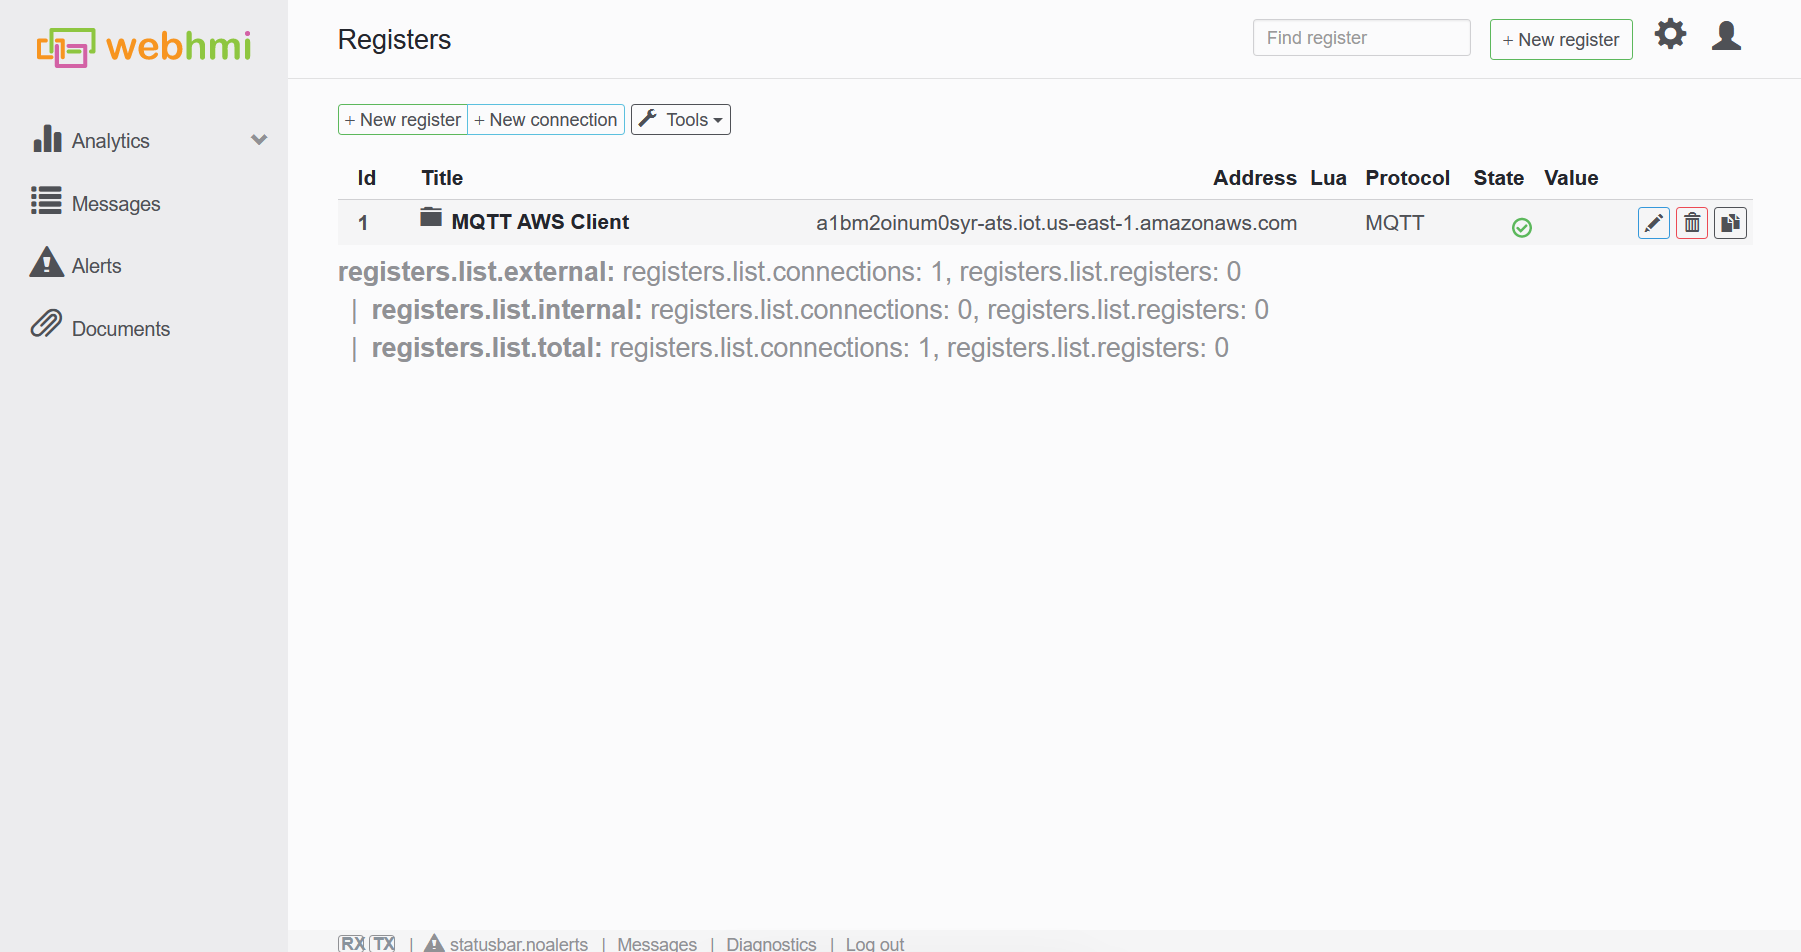
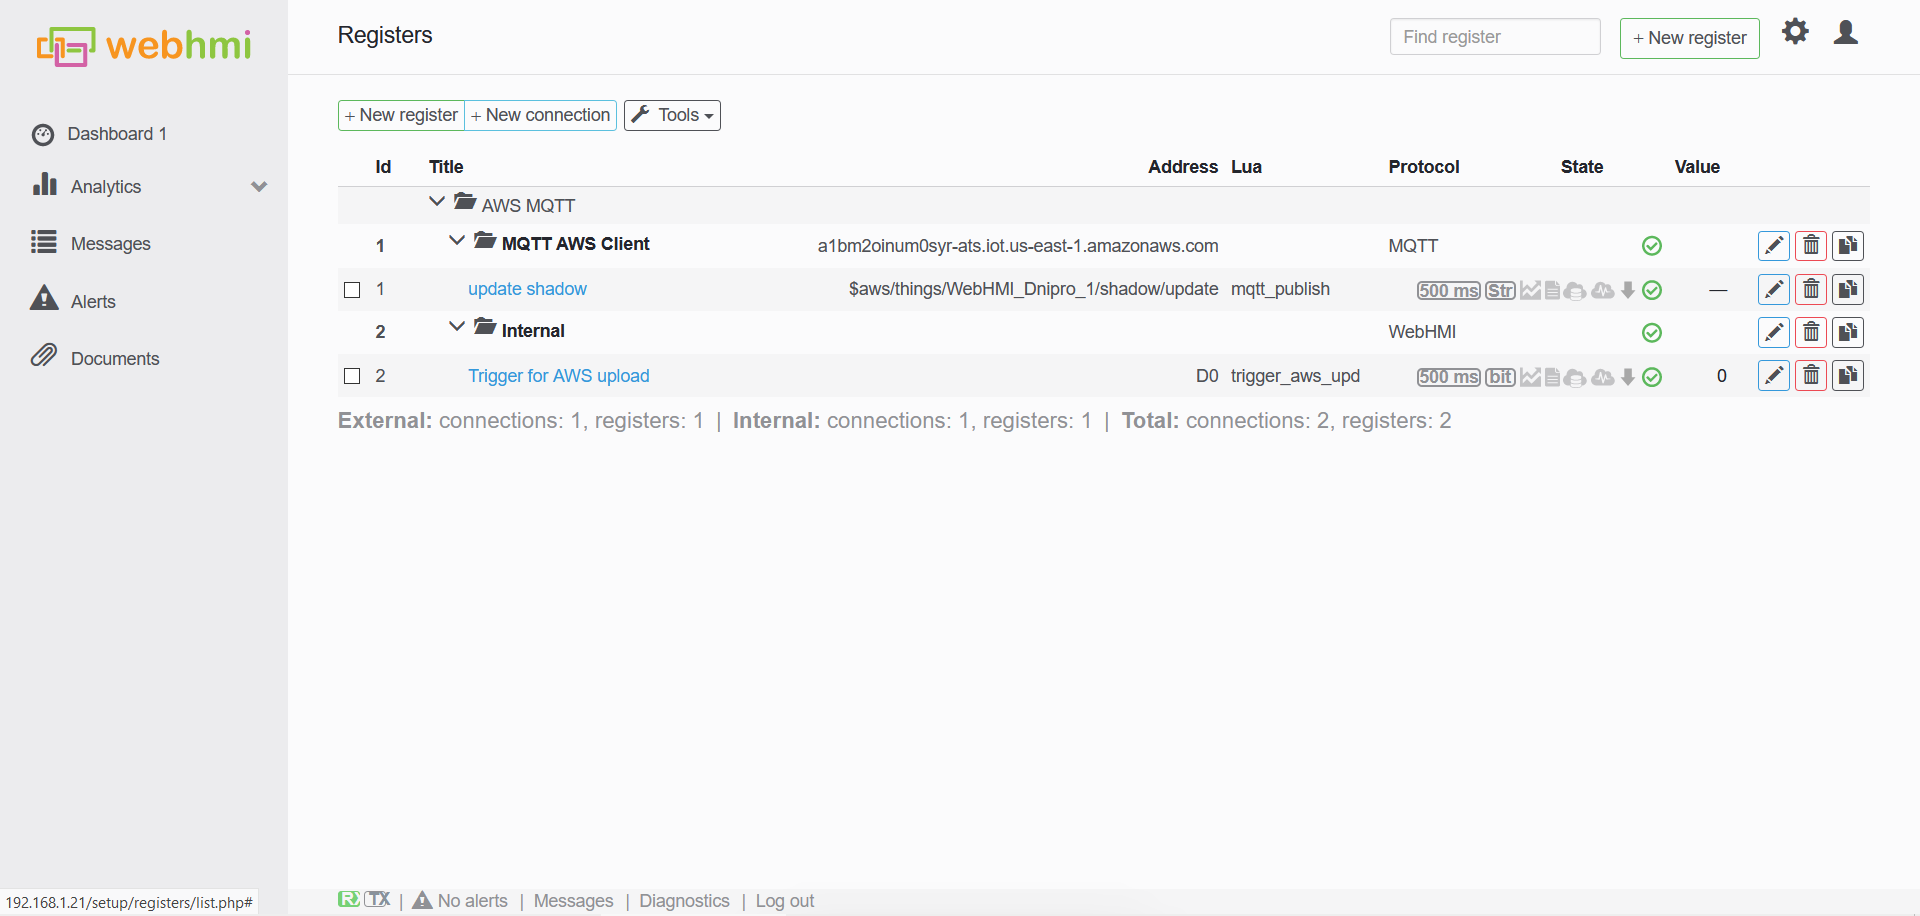
 Now, there is a connection configured. Let's create a register which would correspond to MQTT topic.
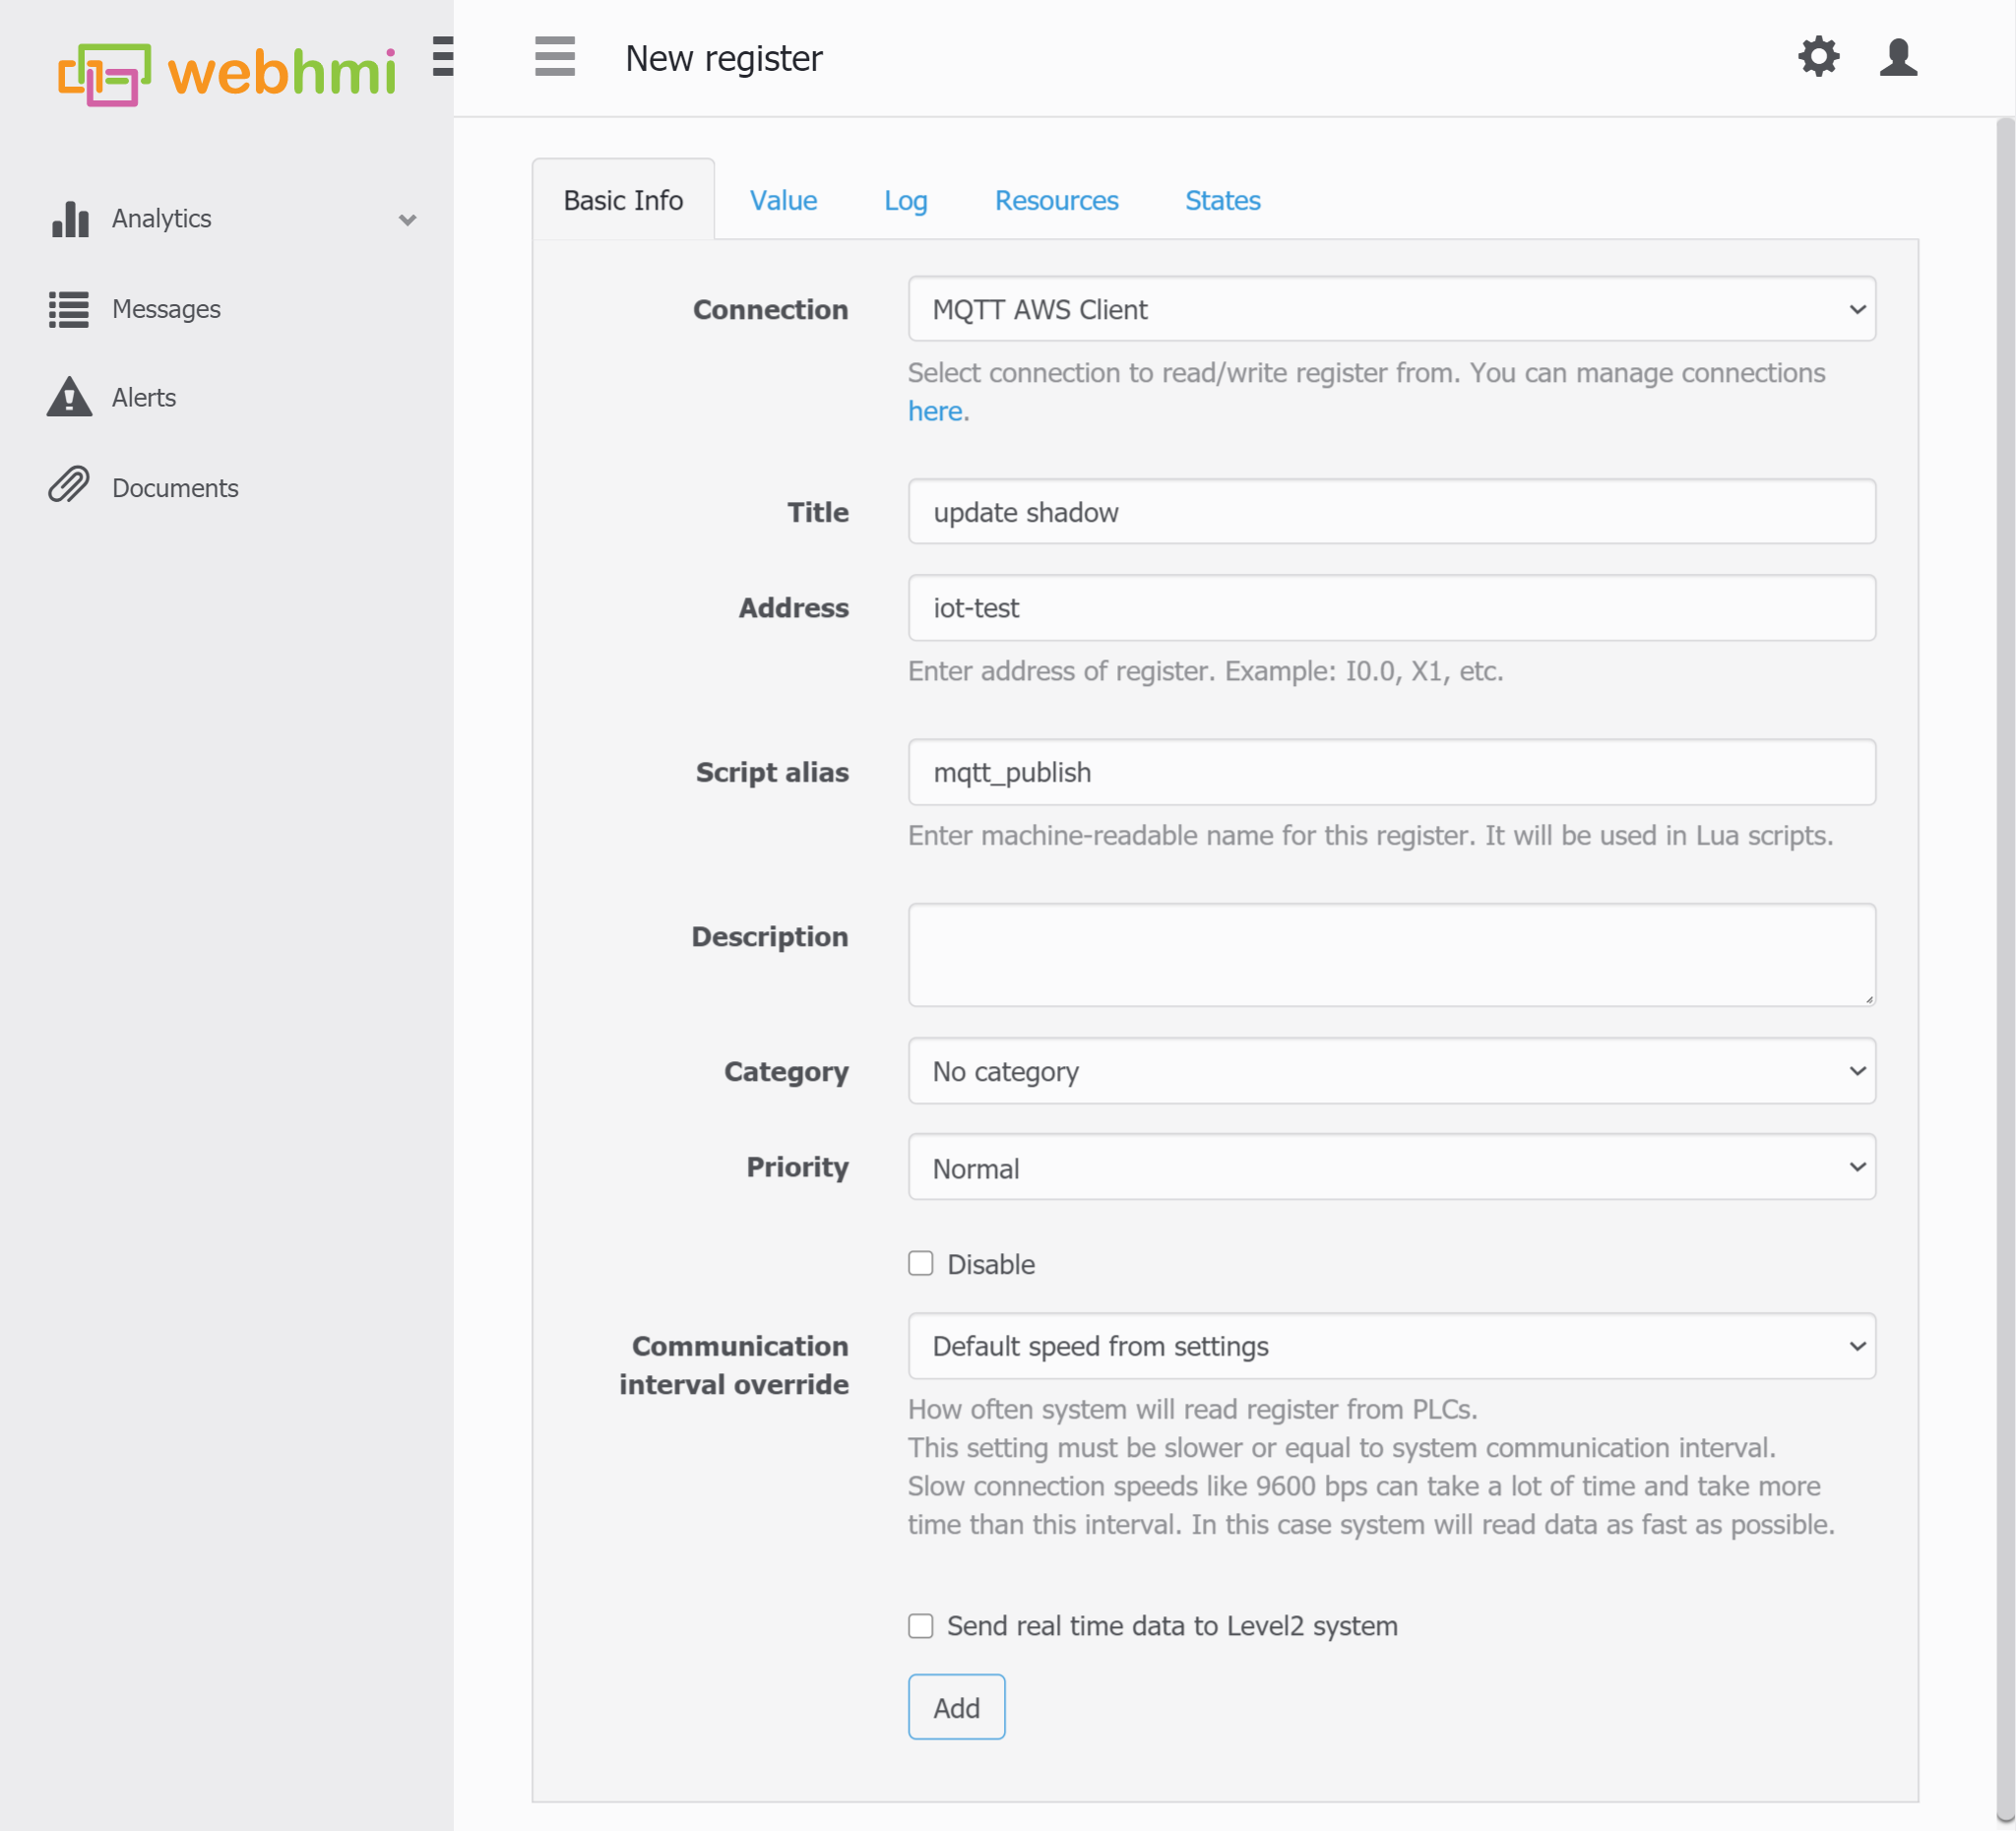
Create a register.
 Select the pre-created connection.
Fill in the Topic name in the Address field.
Select the pre-created connection.
Fill in the Topic name in the Address field.
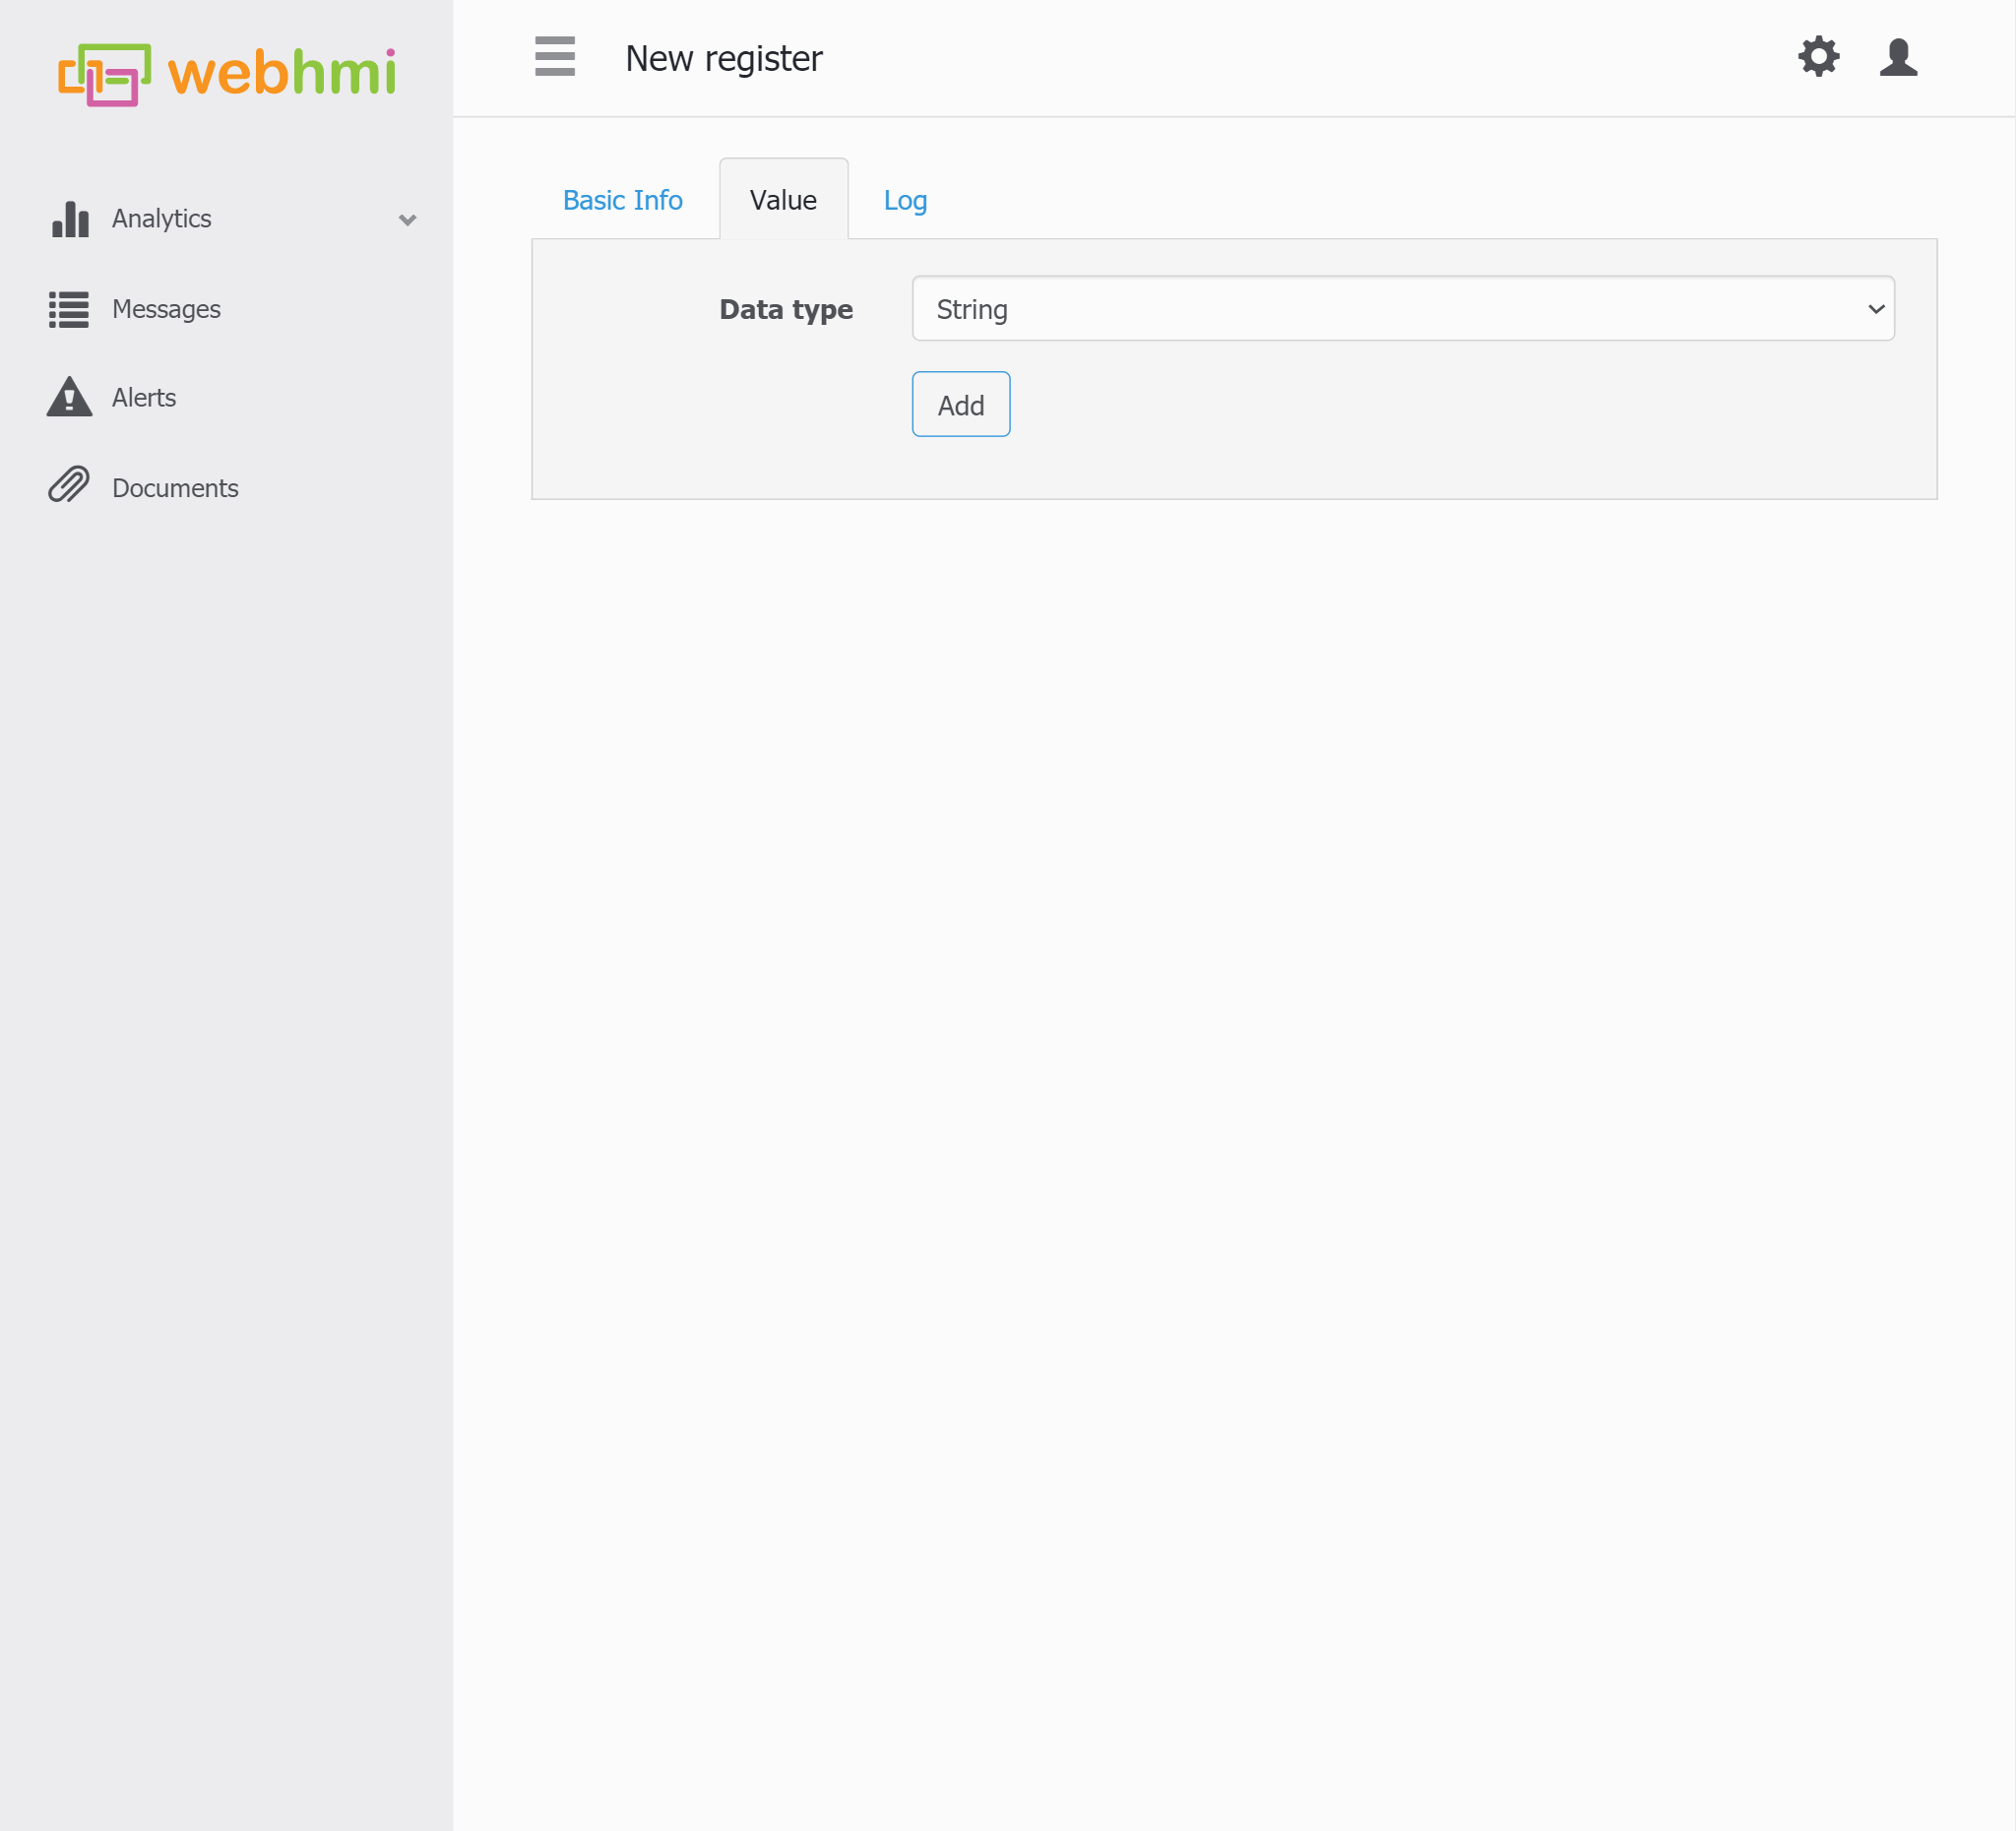
 Also, it is important to switch the value type to String.
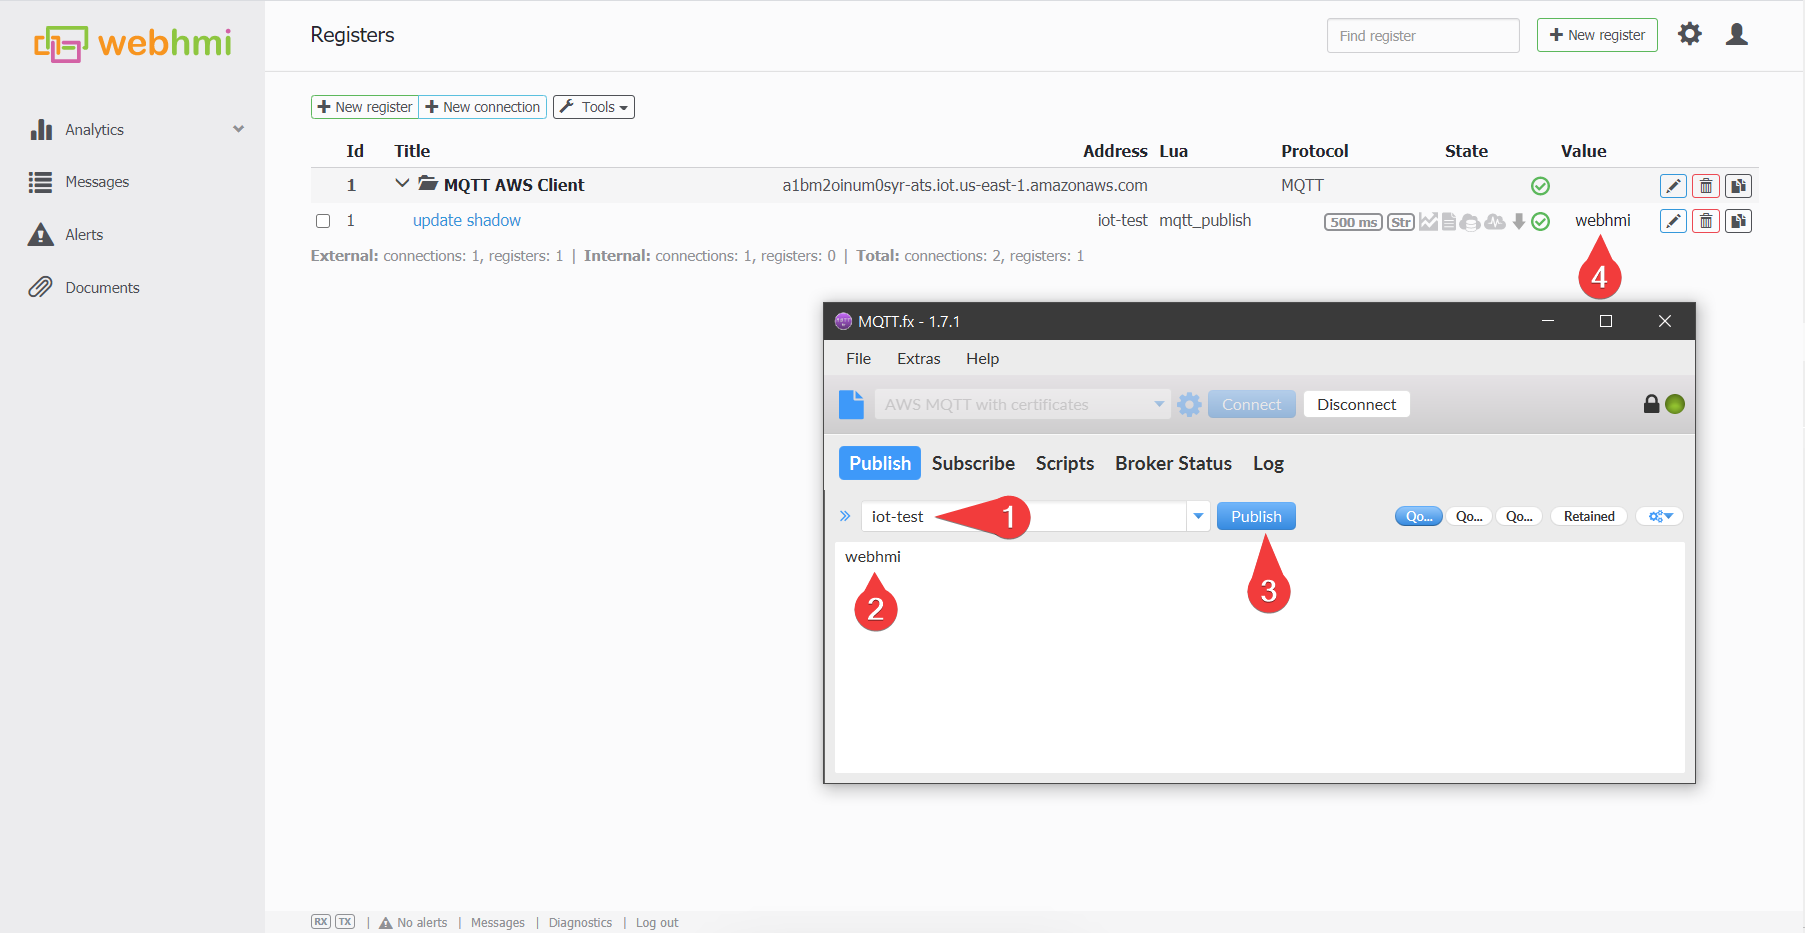
 So to test the connection, let's act WebHMI as subscriber and act MQTT.fx as publisher and vice versa to see the both of clients works well.
For know, it is WebHMI can post the data from real devices to AWS MQTT Client, which allow update to various AWS Thing's Shadow. The data could be visualised data with QuickSight tool and stored this data in DynamoDB with possibility to import as .csv file to S3 bucket for example.
JSON formatted payload
It is widely used MQTT payload format JSON. Let’s write a small script which will use inbuild cjson library to encode any WebHMI register values to JSON formatted strings. Here is the code example to encode a string type message with Amazon Web Services (AWS) Thing Report Shadow JSON format.
- - AWS_thing_report.lua
function main (userId)
    local decoded =
    {
    state =
        {
        reported =
            {
            timestamp       =   os.date("%Y-%m-%dT%H:%M:%S", os.time() - 3 * 60 * 60),
            message         =   "Hello, WebHMI!"
            }
        }
    }
    encoded = cjson.encode( decoded )
                                        DEBUG(encoded)
    WriteReg("mqtt_publish", encoded); -- Test Publish (iot-test@MQTT WebHMI Client)
end
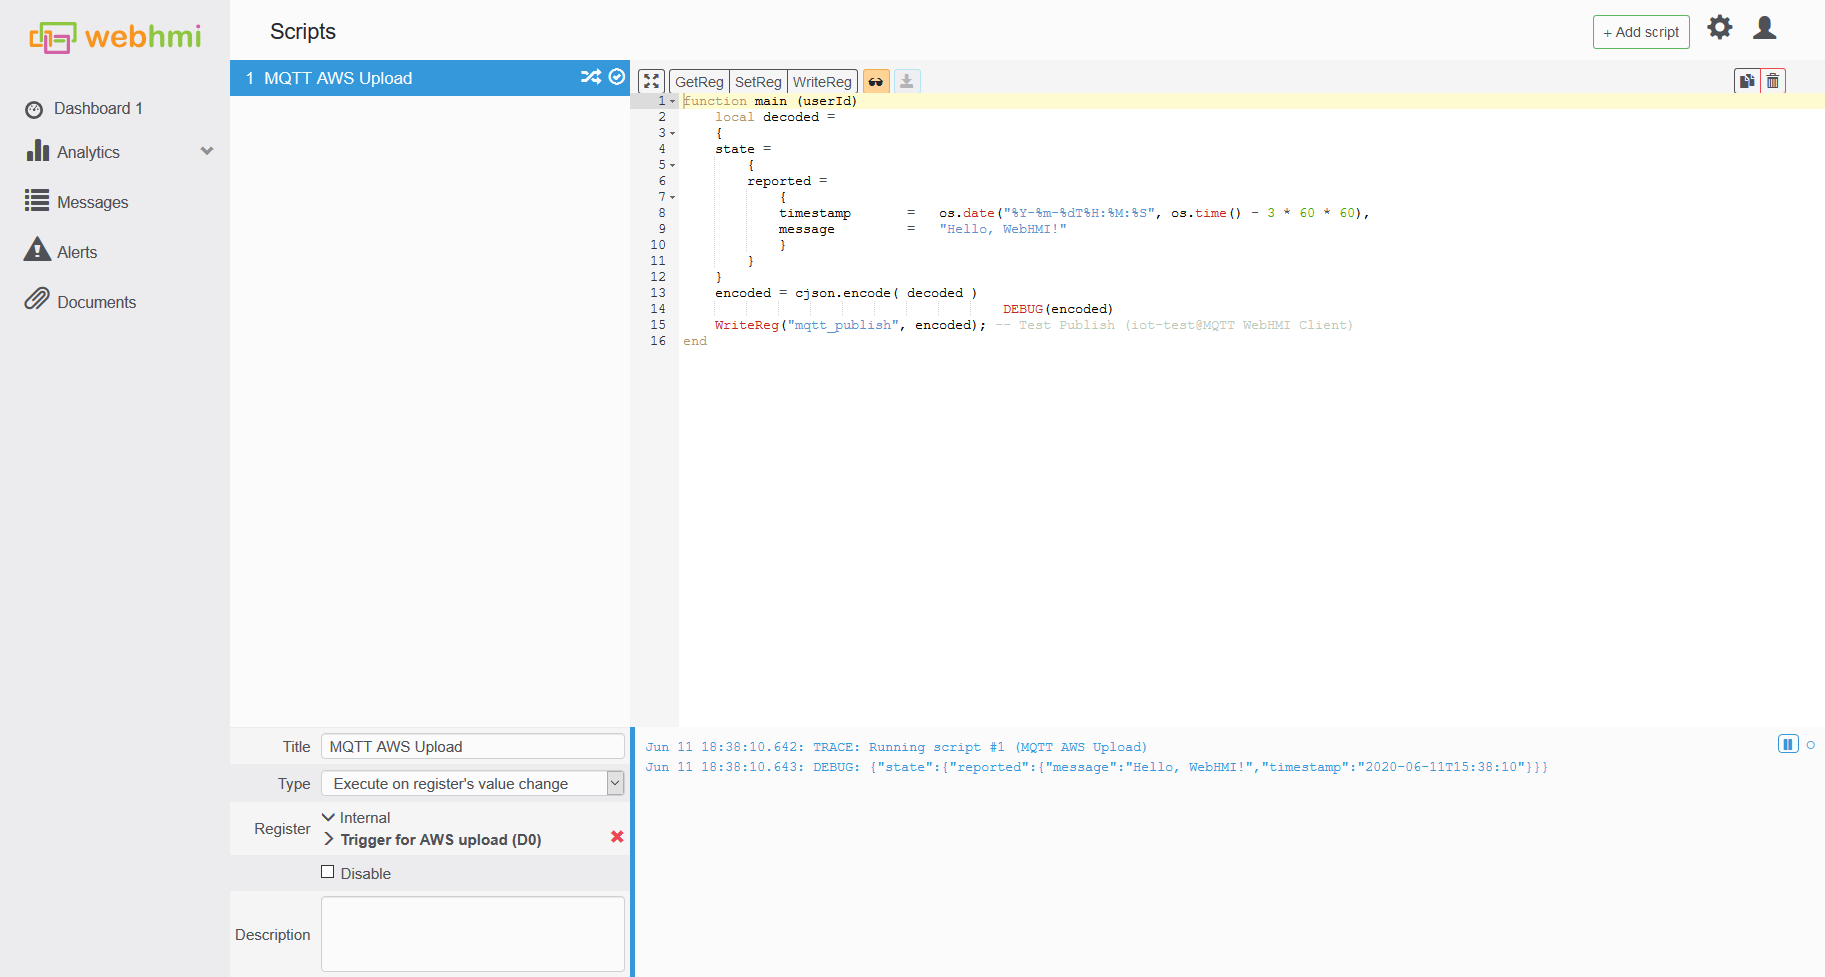 To check the result of script work let’s check
 “iot-test” subscribed topic in MQTT.fx.
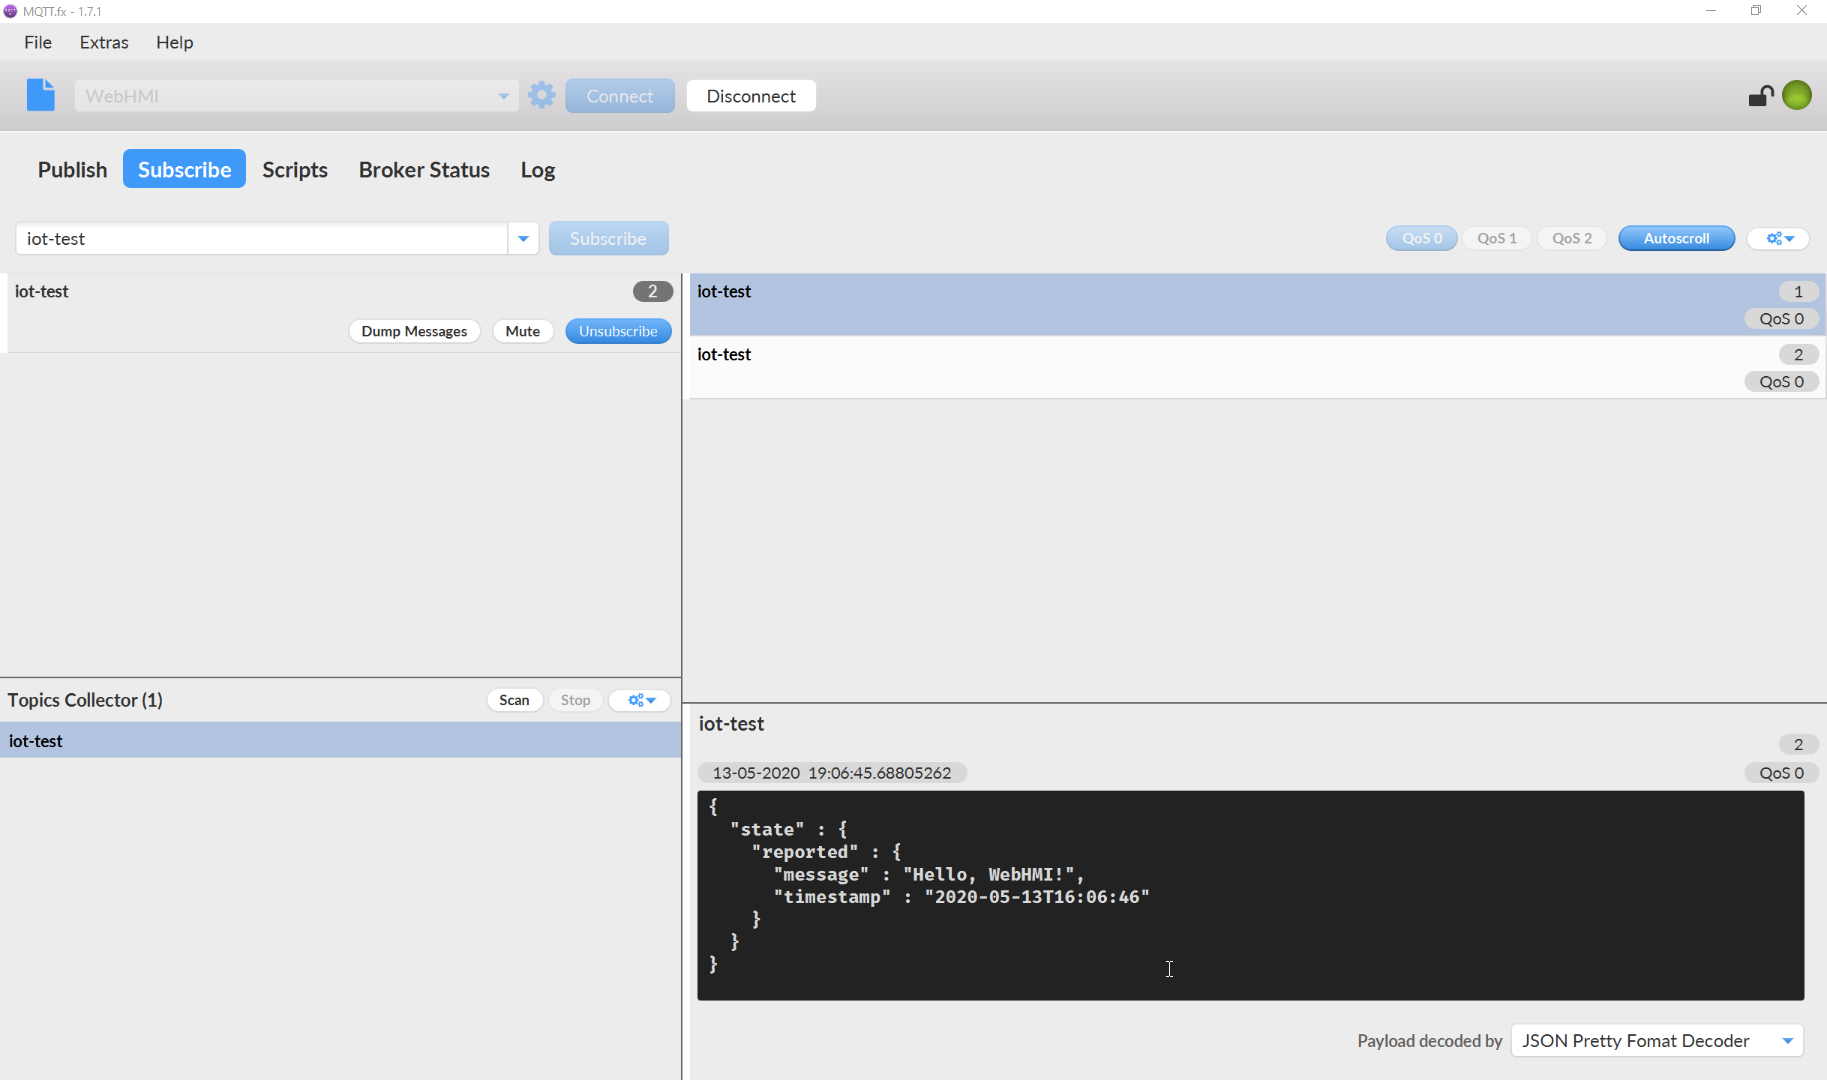
Hint: There is drop-down list with MQTT payload format selector in the lower right corner.
Testing and Next Steps
Testing
Okay, so now it is working AWS MQTT communication and tested successfully.
The next step is to reconfigure MQTT topics from iot-test to Thing's Shadow …/update topic.
 There is a trigger to run script, by the register's value change to post a message to AWS.
 This settings will lead the message to AWS IoT Core Rules processing, and in the end hitting to DynamoDB table.
Setting up trigger script
There should be a trigger to change the register's value to post a message to AWS, because of too short duration of scan and superfluity of update frequincy for cloud data processing.
For the testing purpose you can do this manually.
 After that, check the DynamoDB Table's Item append.
 When you ensure, that data comes to DynamoDB triggered by auxilary WebHMI register change, you can set up the trigger's toggle by script.
As an example there is two practices such as time dependent (oscillator) or quantity depended (decimation) trigger.
Oscillator code:
If there is a neccesity to post with predefined frequency, for example 15 second can be done with following script.
a1,a2,a3,a4 = 0,0,0,0

function TOGGLE(reg)
    WriteReg(reg, 1 - R(reg))
end

function main (userId)

    if GetReg("GT") % 15  == 0 then -- Global Time (T0@Internal)
                TOGGLE("aws_trigger")
                decimation_counter = 0
    end--if

end--eof
Decimation code:
If there is several target register, such as counter, counter2, etc., but if it changes too often, this code will help to decimate the output trigger signal.
a1,a2,a3,a4 = 0,0,0,0

decimation_counter = 0;
DECIMATION = 10

function TOGGLE(reg)
    WriteReg(reg, 1 - R(reg))
end

function main (userId)
                            if decimation_counter>1 then DEBUG("decimation_counter:"..decimation_counter) end

                            -- check if target registers changed
    flag =  a1 ~= GetReg("counter")
                        or
            a2 ~= GetReg("counter2")
                        or
            a3 ~= GetReg("counter3")
                        or
            a4 ~= GetReg("counter4")

    if flag then
        decimation_counter = decimation_counter + 1
    end

                            -- update local variale values for next scan check
    a1 = GetReg("counter") -- Counter 1 (D0@Internal)
    a2 = GetReg("counter2") -- Counter 2 (D0@Internal)
    a3 = GetReg("counter3") -- Counter 3 (D0@Internal)
    a4 = GetReg("counter4") -- Counter 4 (D0@Internal)

                            -- DEBUG trace
                            DEBUG("aws_trigger" .. ":" .. R("aws_trigger") .. " flag:" .. tostring(flag))
                            DEBUG("a1:"..a1)
                            DEBUG("a2:"..a2)
                            DEBUG("a3:"..a3)
                            DEBUG("a4:"..a4)

                            -- decimation_counter for not too often  upload to AWS
    if decimation_counter >= DECIMATION then
            TOGGLE("aws_trigger")
            decimation_counter = 0
    end--if decimation_counter

end--eof
Next steps
Create visualisation environment
To use Kibana visualisation firstly you need to run an ElasticSearch engine deployed on virtual machine.
So the idea is to create ElasticSearch Instance with Kibana plugin on-board.
Fortunately, there is a detached Menu item in Analytics AWS Services group.
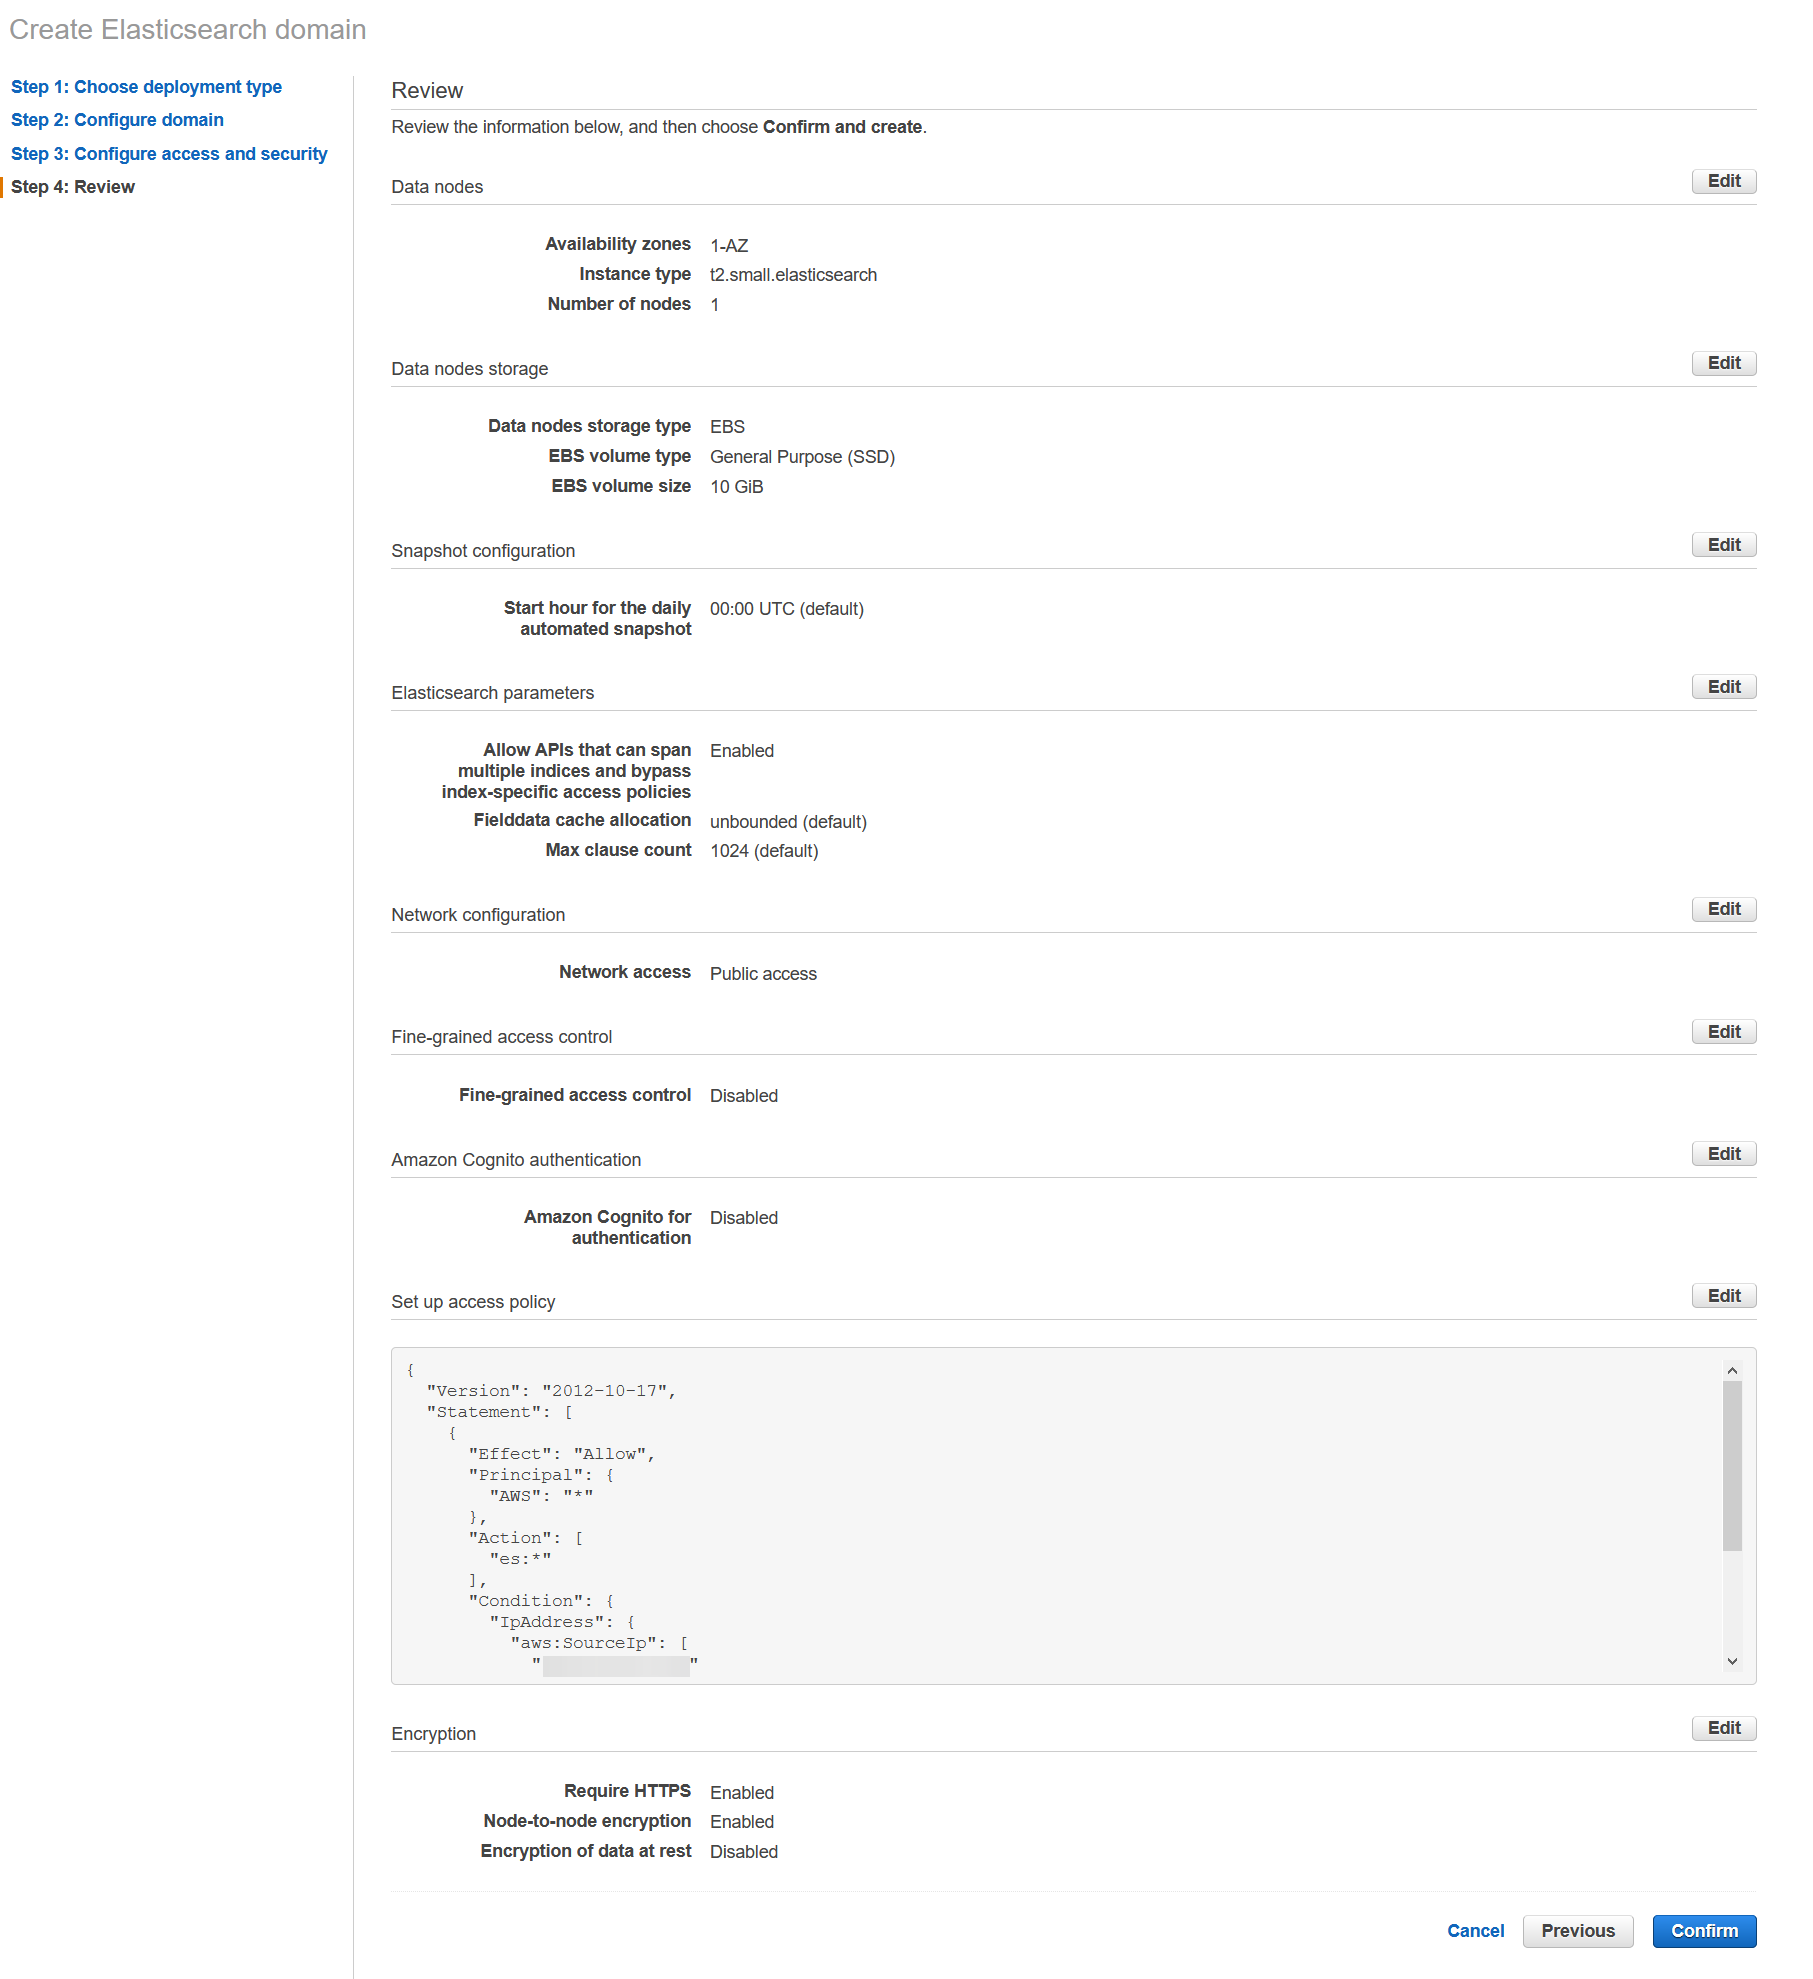
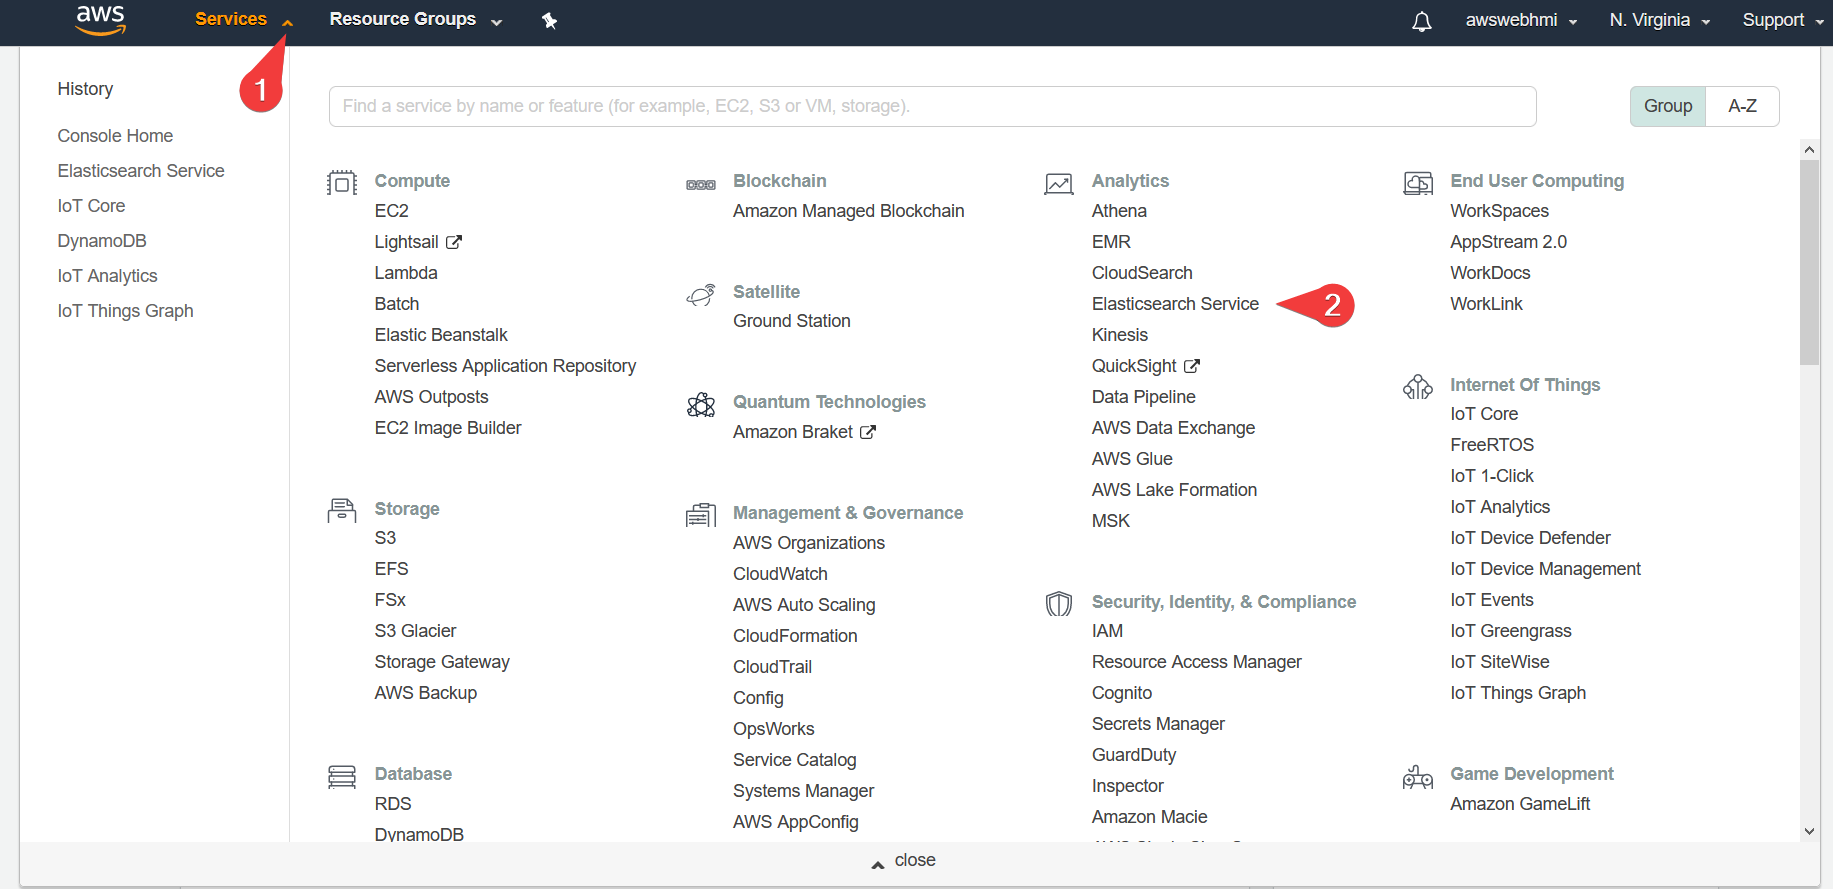 So, crete a new one instance with following settings.
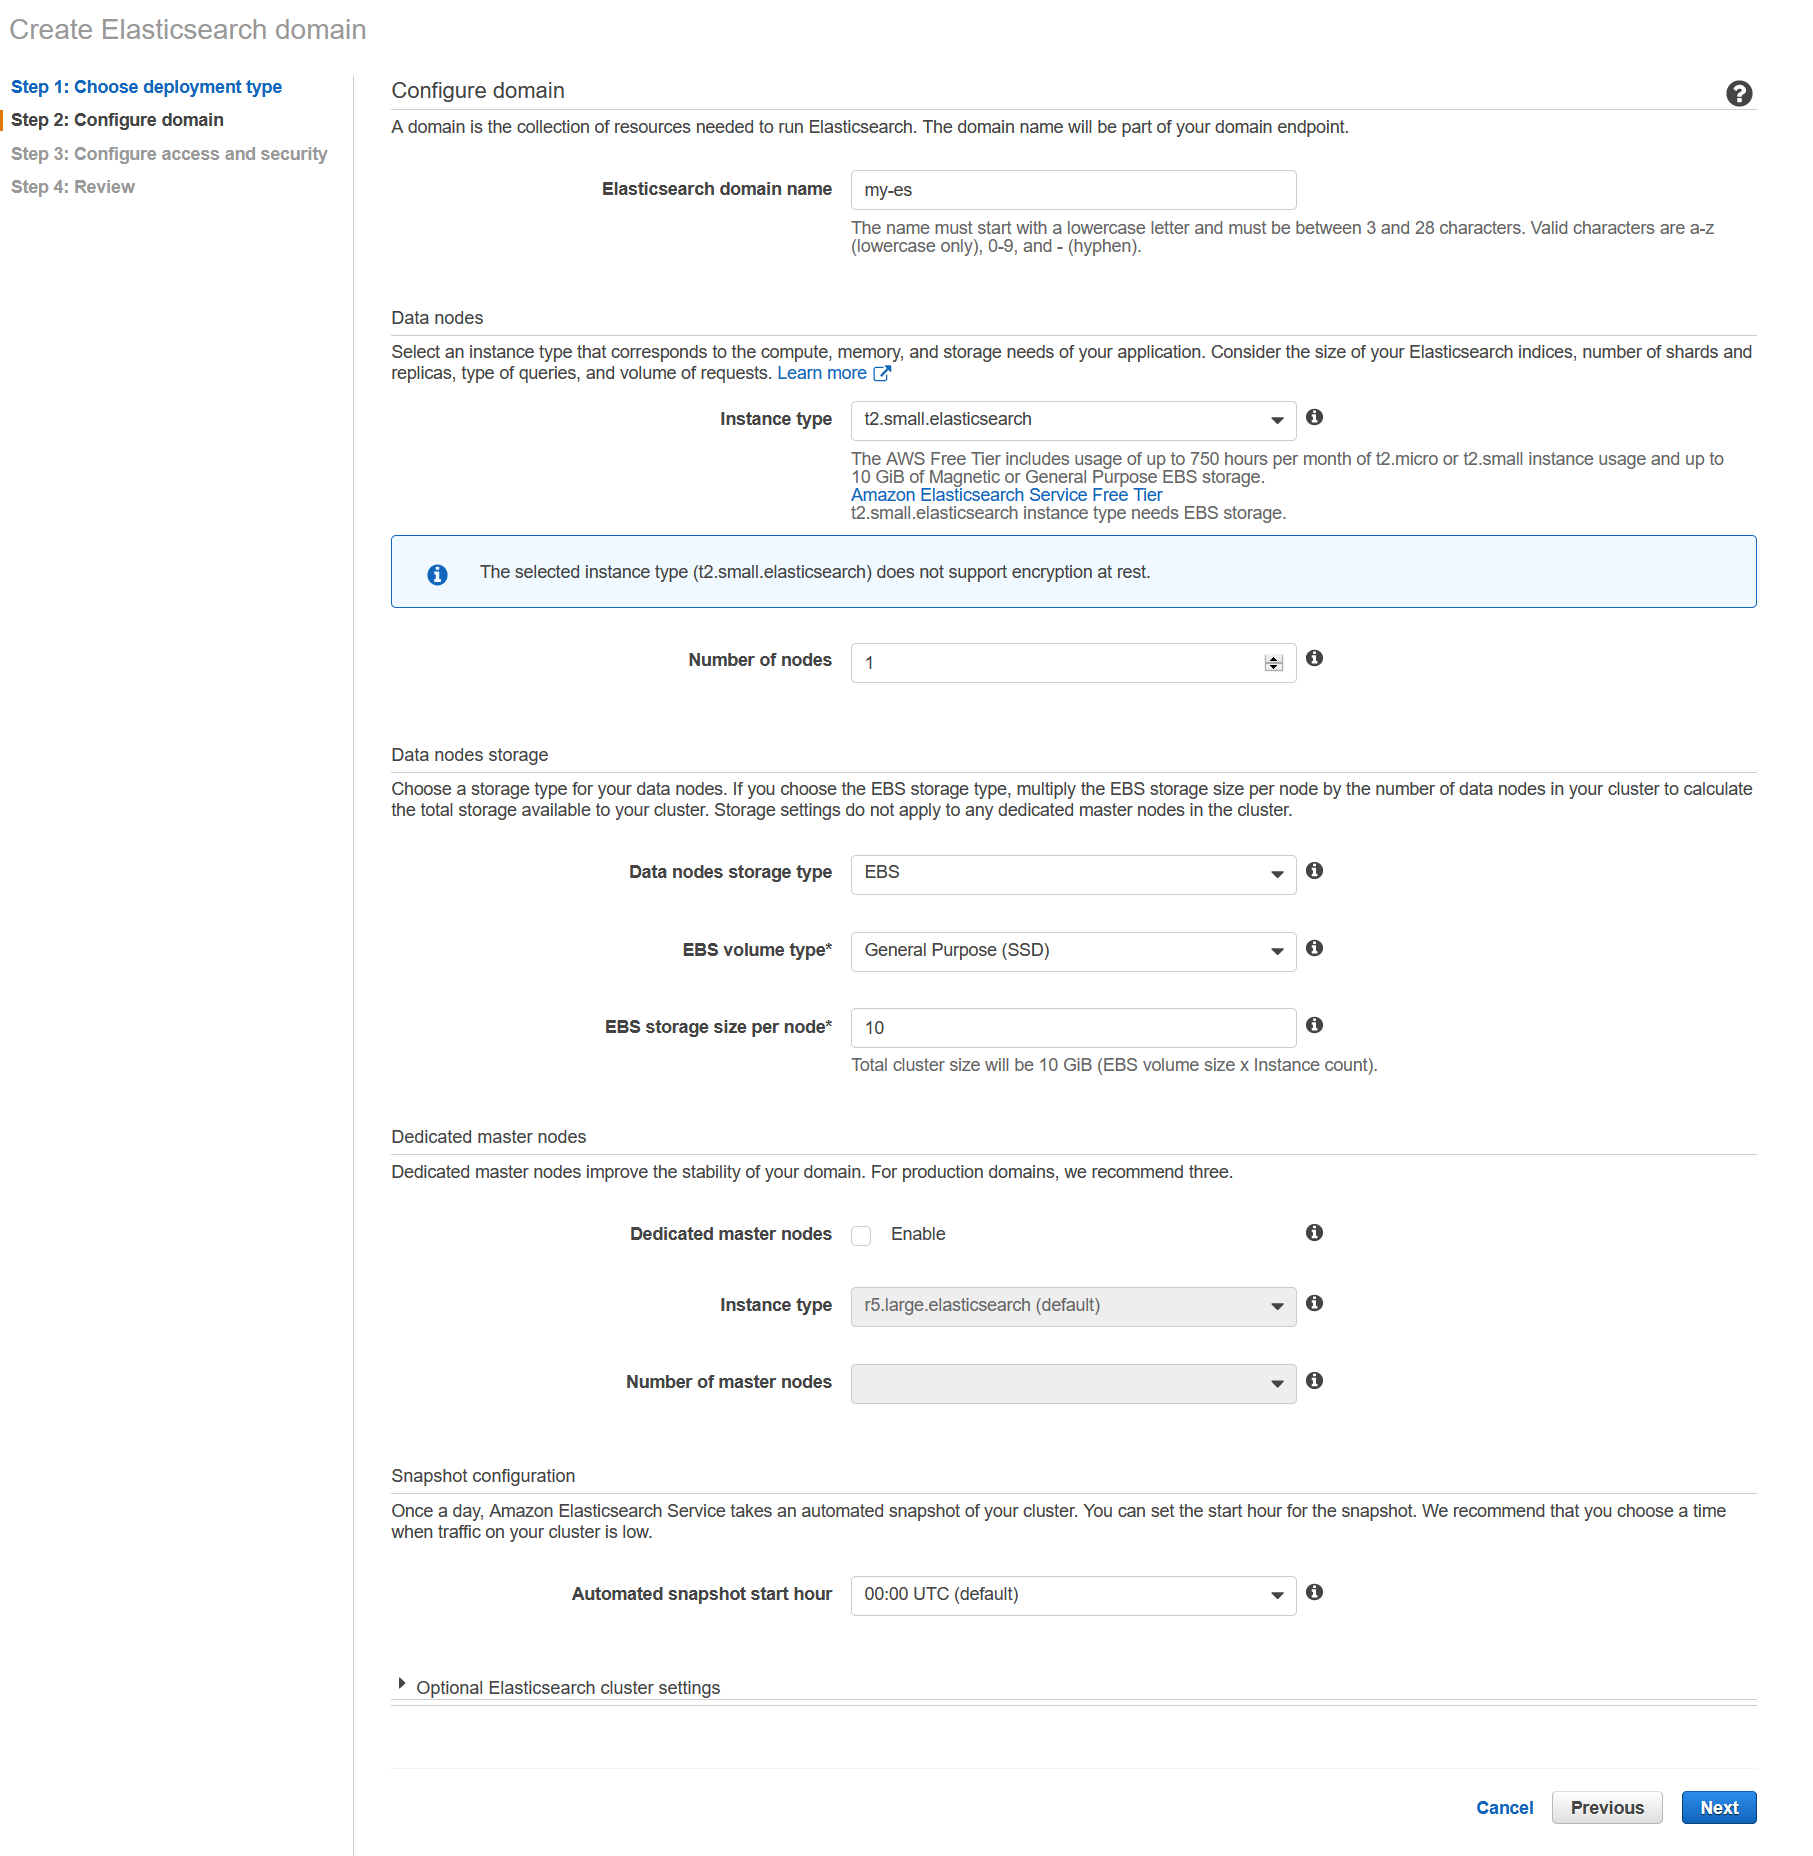
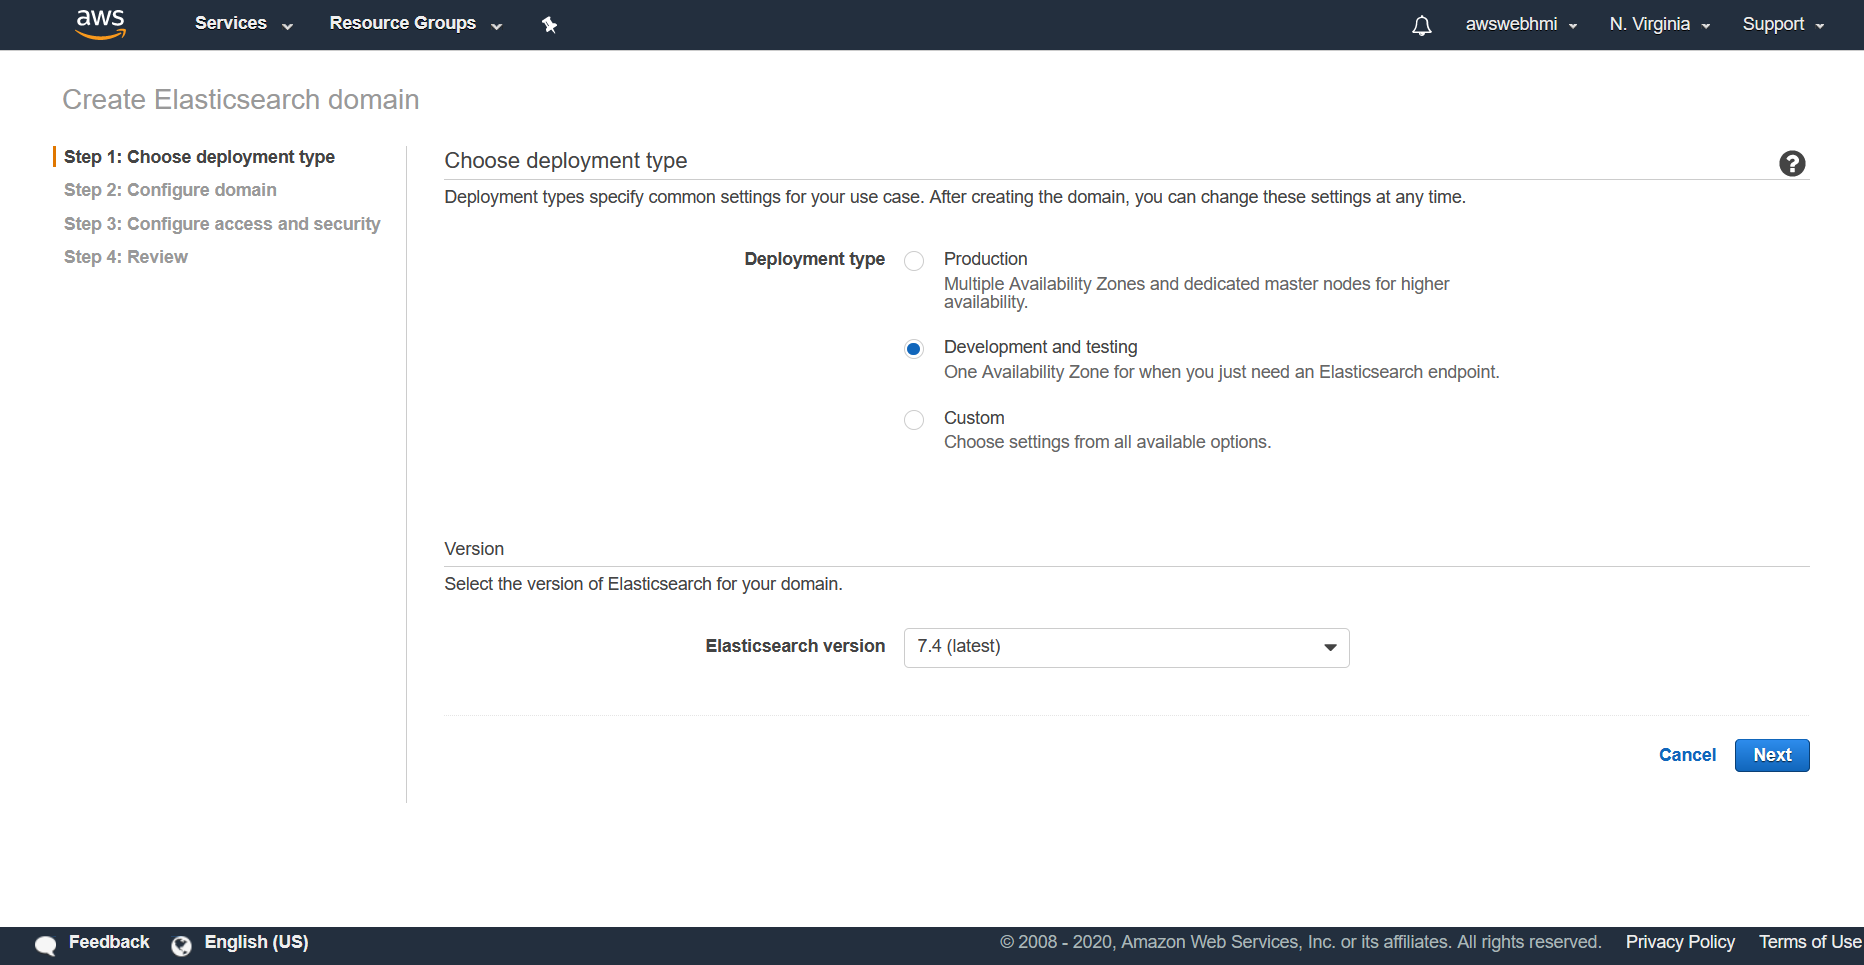 Specify domain name and instance type (size, e.g. t2.small).
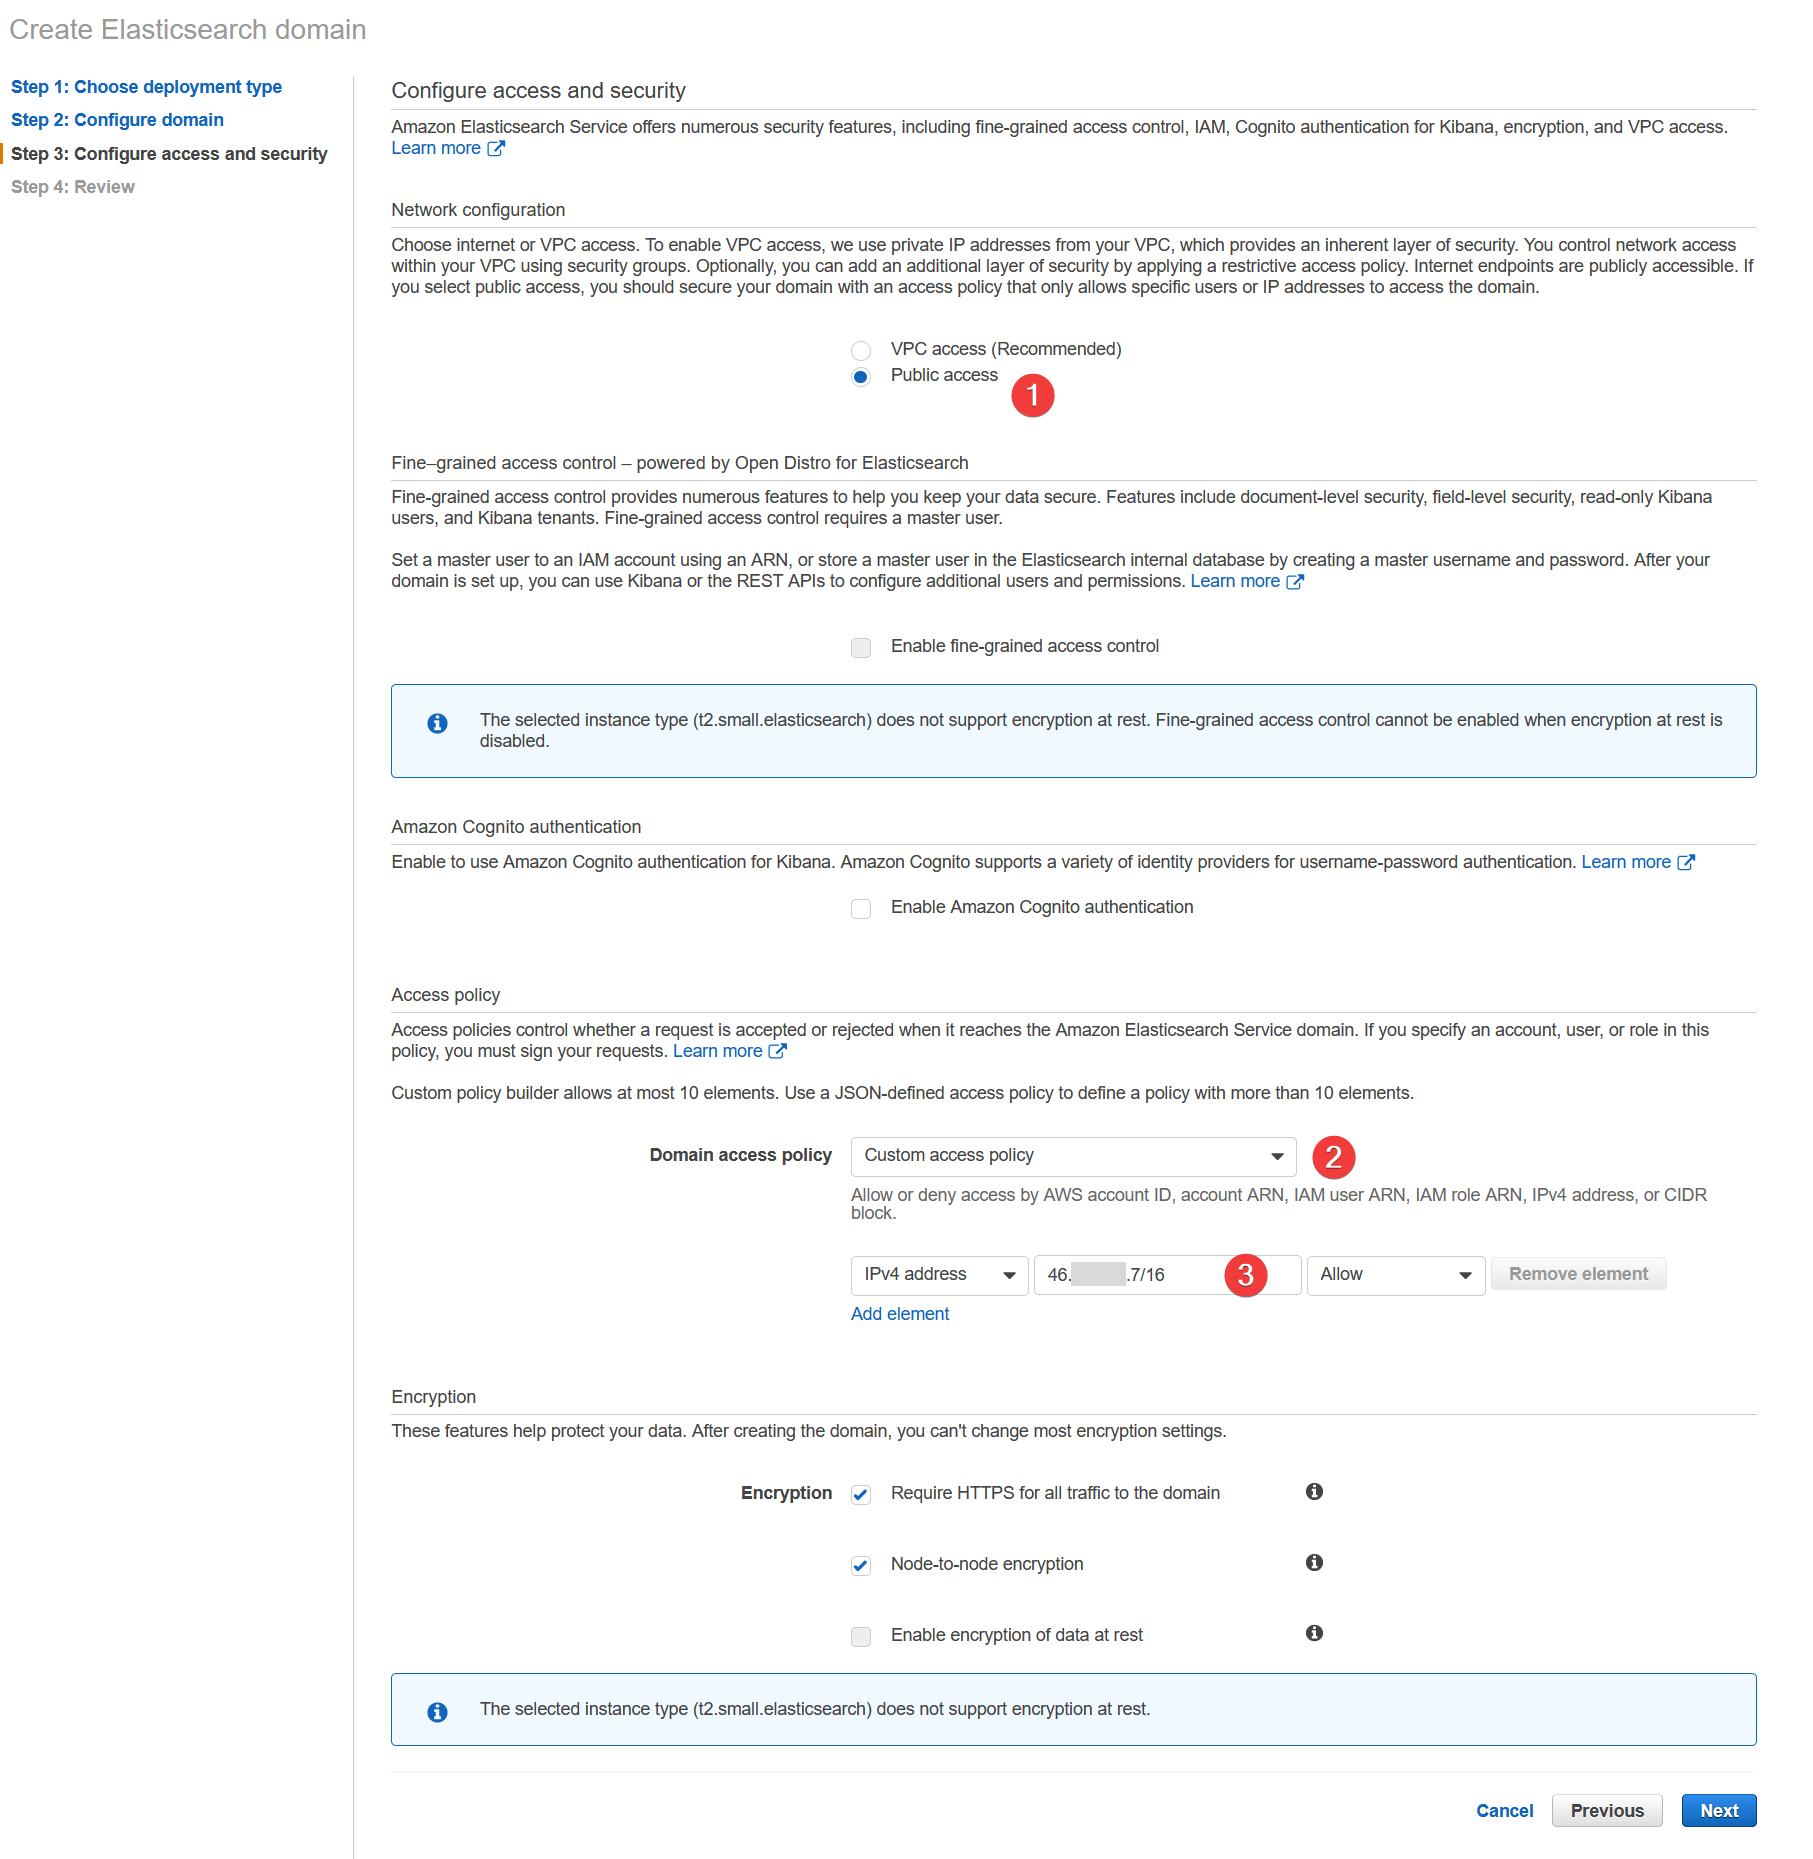
 Specify the access policy, the good practice is a public one, but there is should IP resctiction be specified.
 To check IP use myip.com.
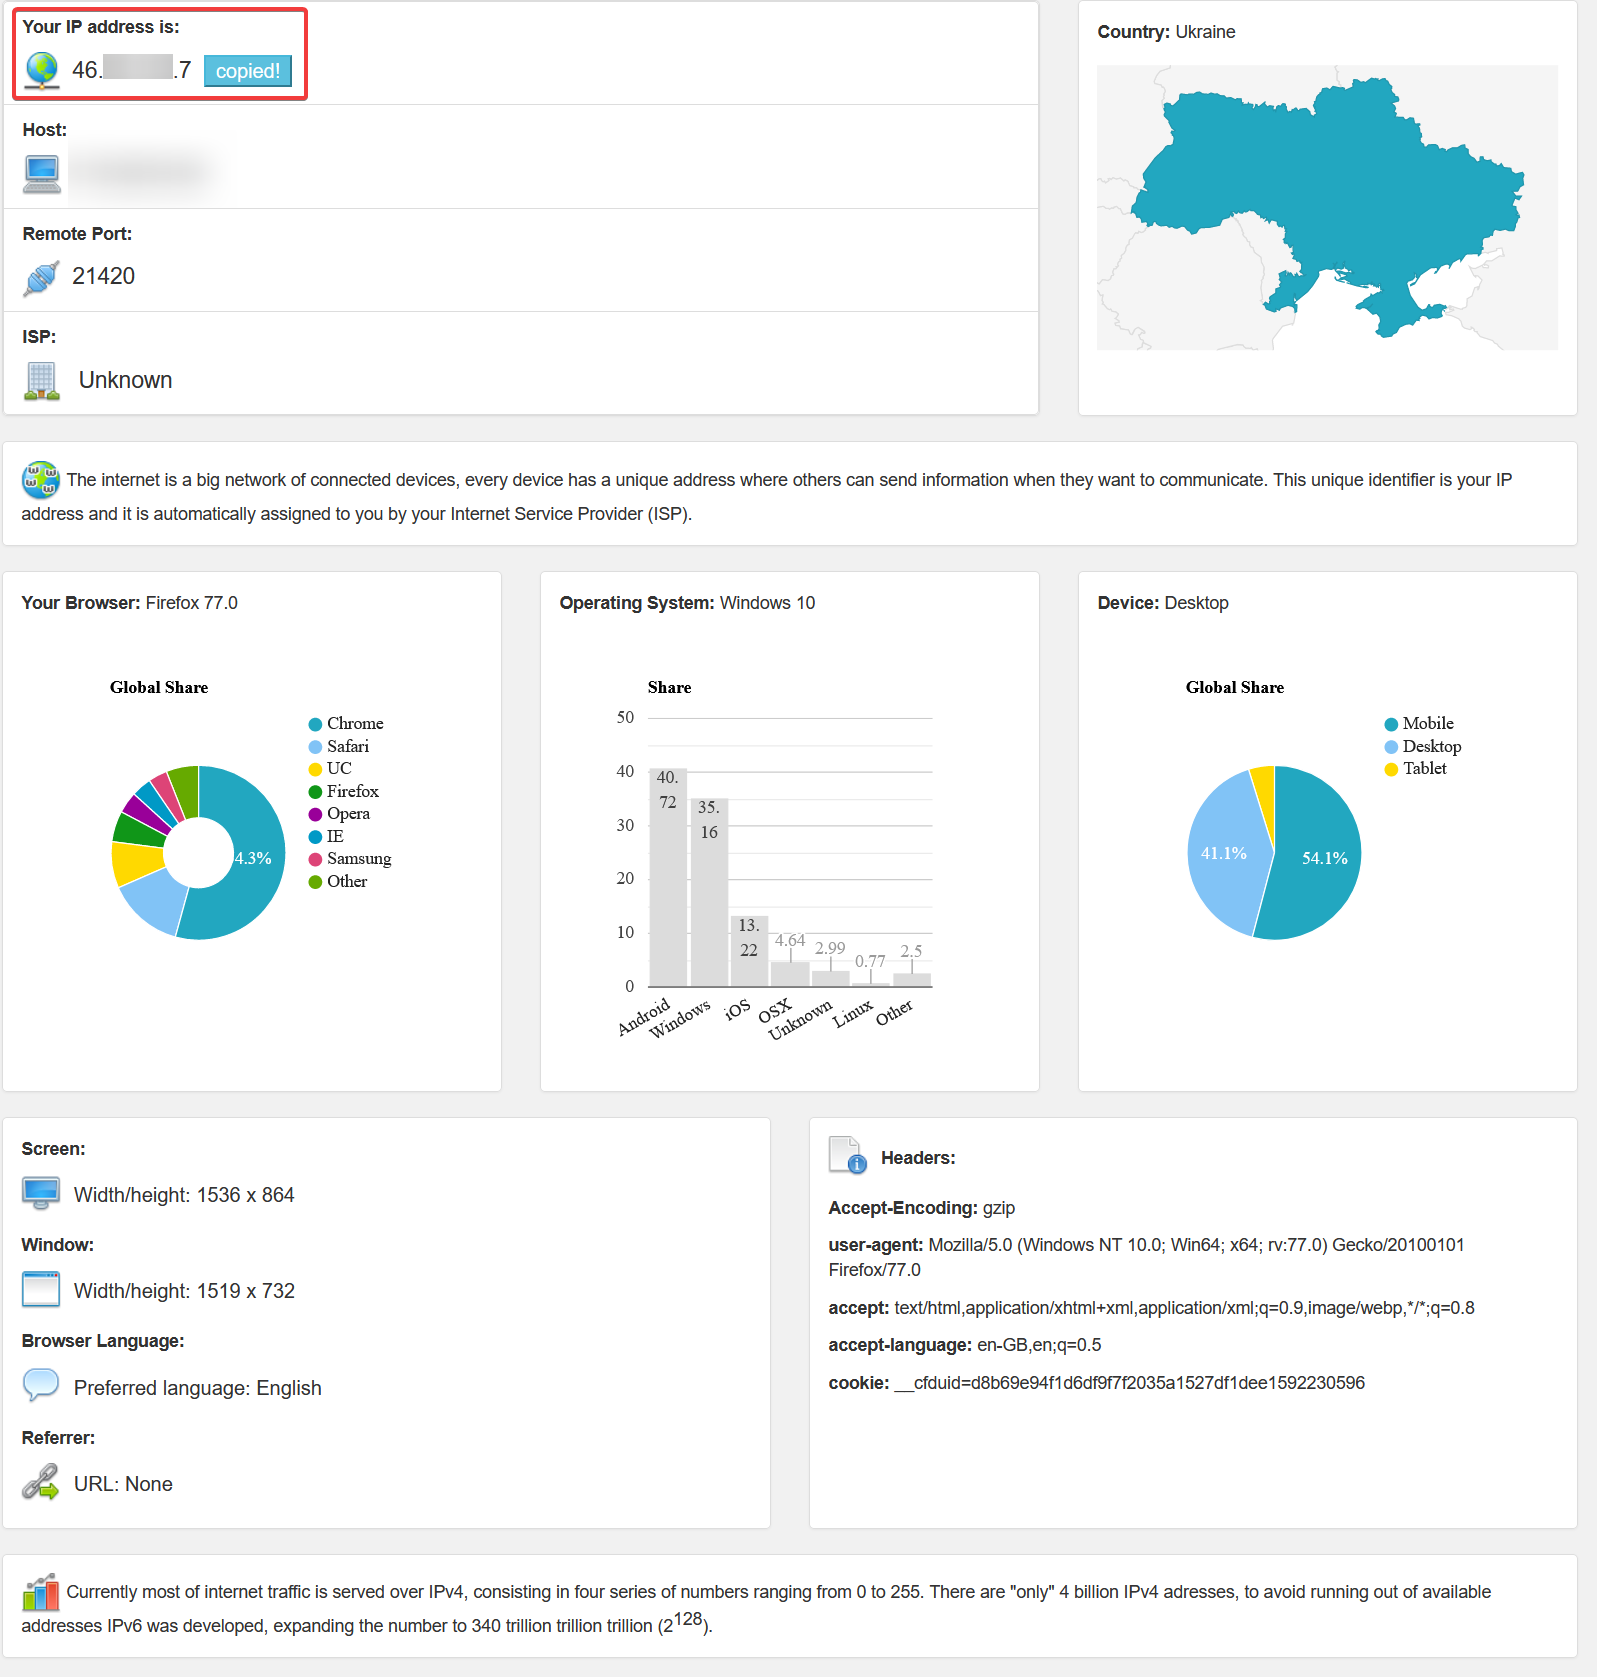 The first line has your current IP.
As a CIDR block you can rewrite you IP as XXX.XXX.XXX.XXX/16, where 16 is a number or bit, that can be changed to still satisfy the condition, so that will form a IP adresses range, which will protect your from ISP pool IP mascarading.
Otherwise, copy your IP to field as is.
The first line has your current IP.
As a CIDR block you can rewrite you IP as XXX.XXX.XXX.XXX/16, where 16 is a number or bit, that can be changed to still satisfy the condition, so that will form a IP adresses range, which will protect your from ISP pool IP mascarading.
Otherwise, copy your IP to field as is.
In the end, this will lead your to this settings. Review it and confirm creation if it fine.
 After the creation, in several minutes it will be endpoint adress created
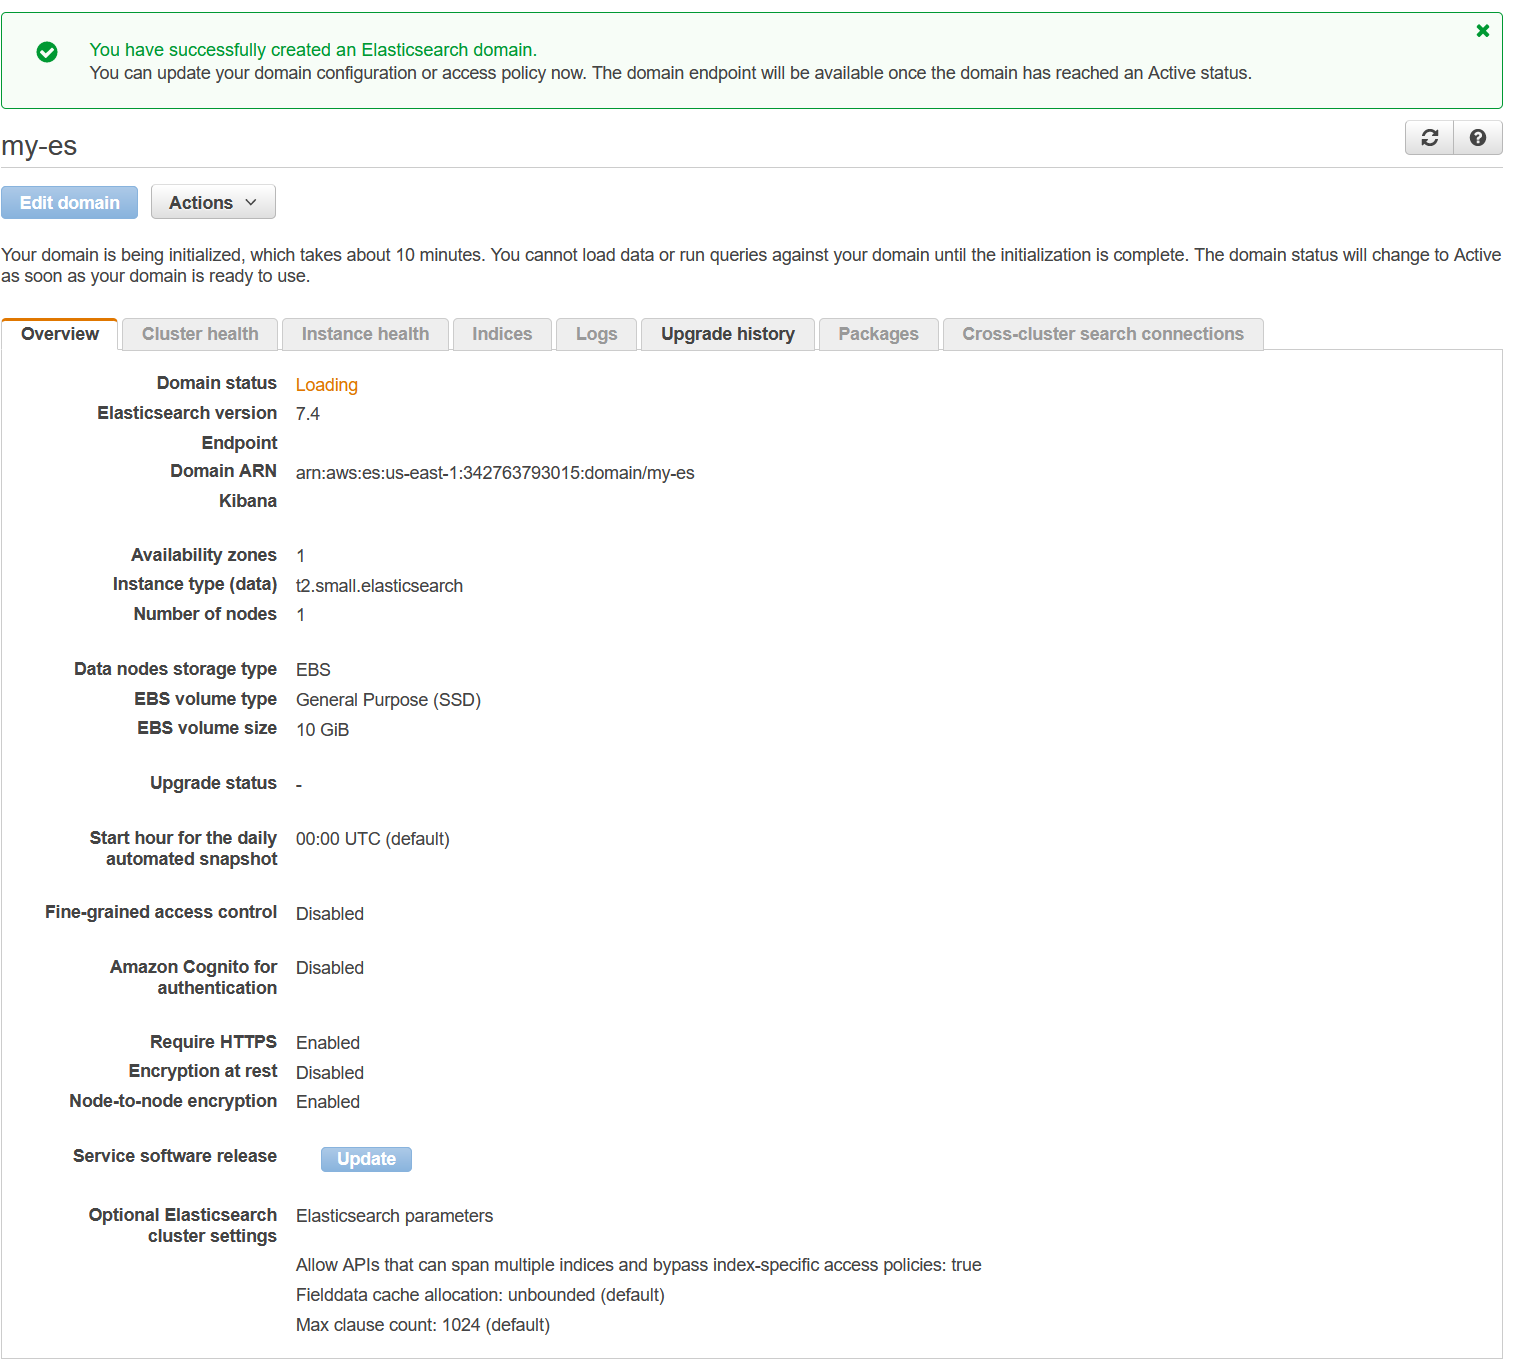 Wait until it would be done.
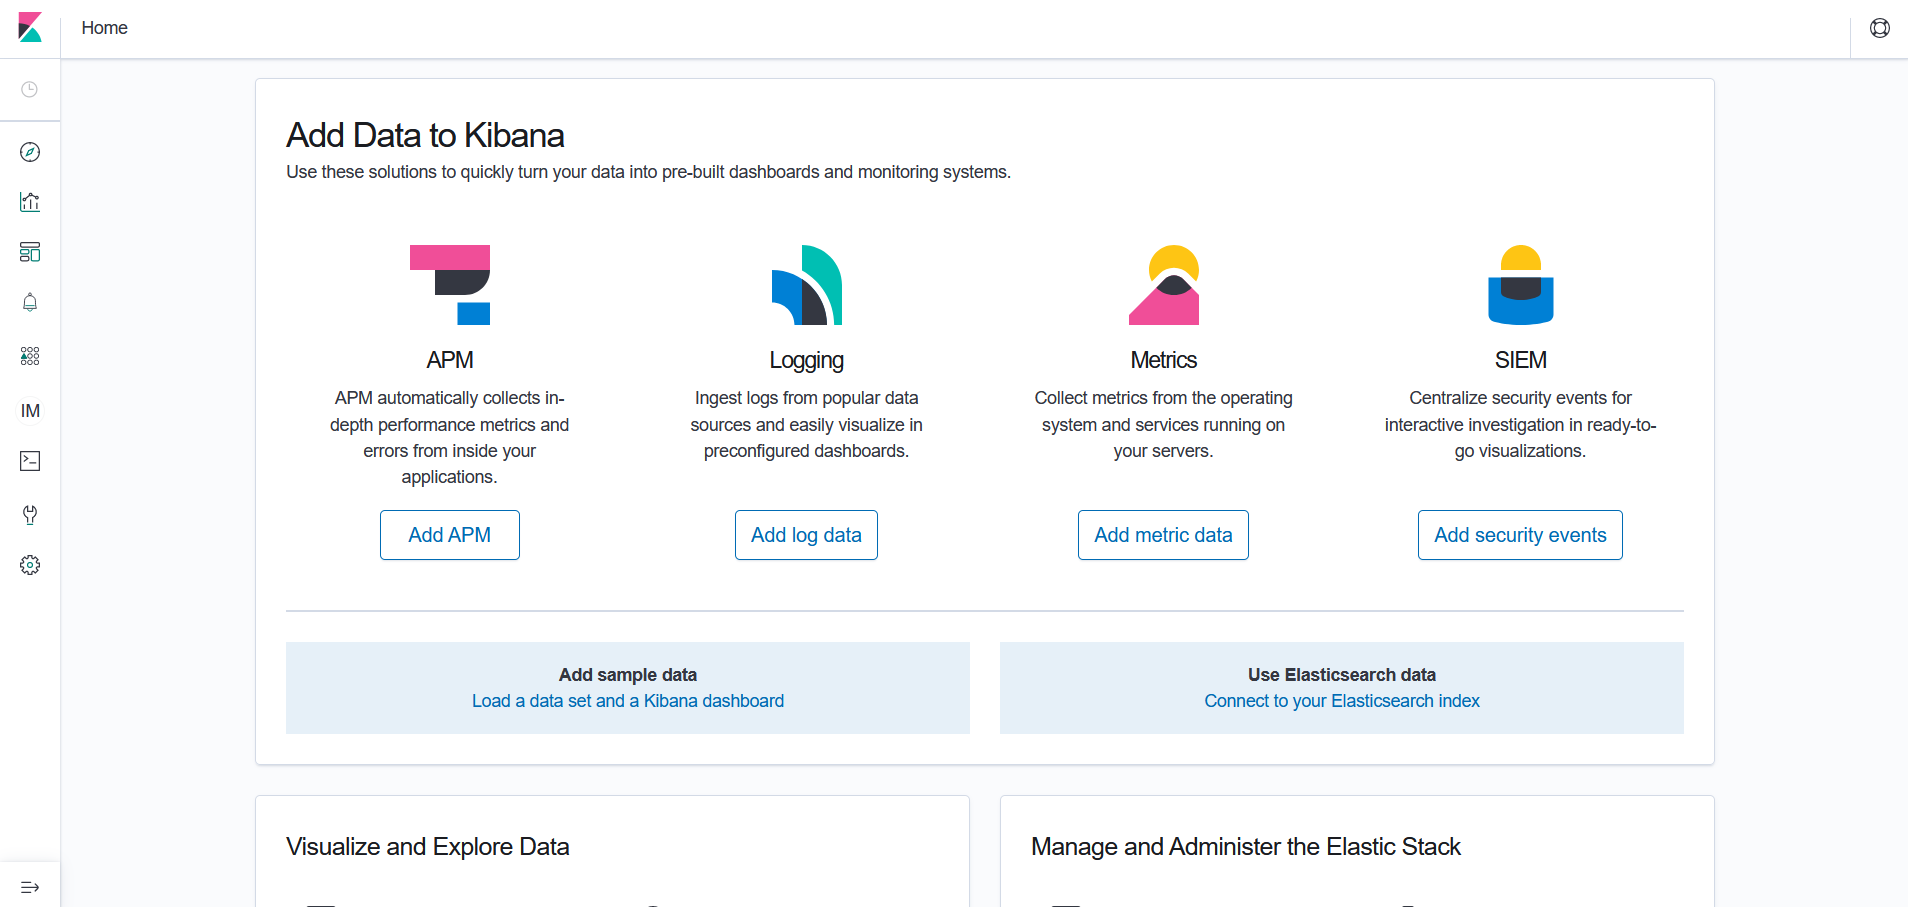
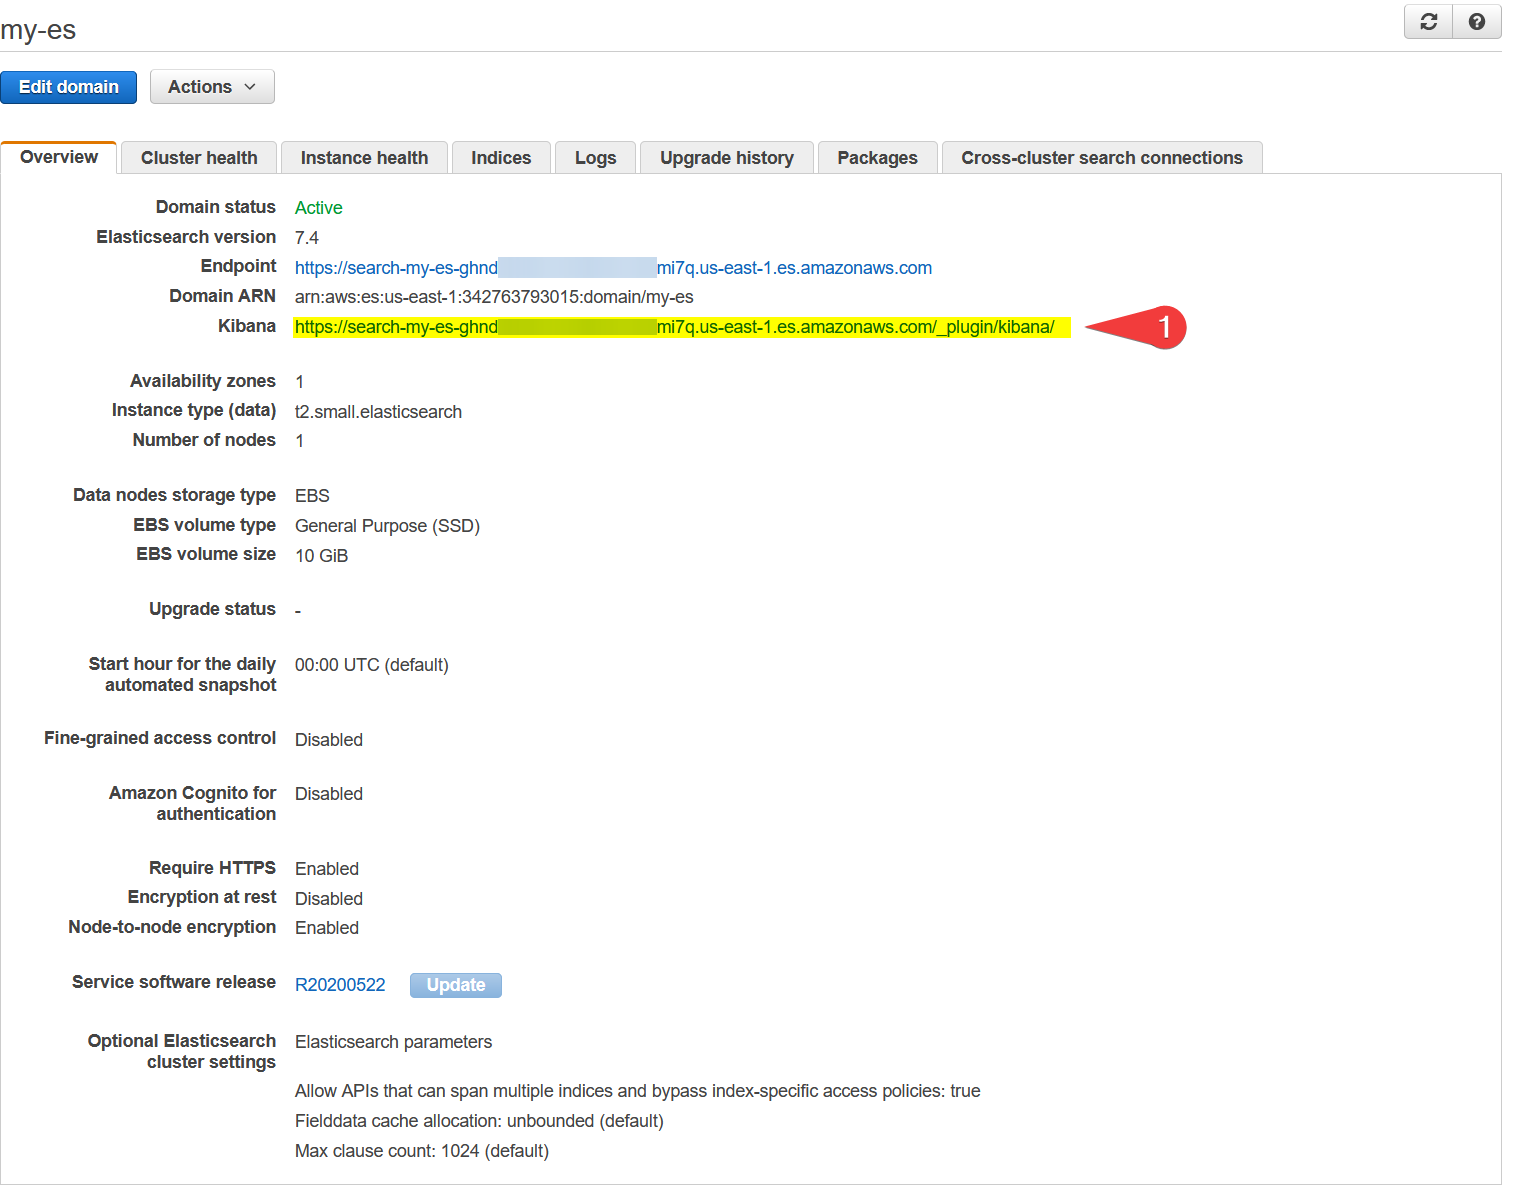 At this moment, you will have access to Kibana plugin, the following link is provided above.
Change MQTT payload to meters data as demo project
Let's burn project to WebHMI with virtual electric meters. It is simulate power consumption with predefined daily load curve but small fluctiations. Just like real power system does.
So let us formulate JSON payload (according to AWS Shadow rules) those registers with output data, which represents consumpted energy in kWh.
It is possible to recalculate in script values to kWh from impulses number e.g. and add a metadata such as location, timestamp etc. Here is an examples of code to do this.
- - IoT Core Rule SQL-like query for virtual counters
SELECT CAST(state.reported.counters.value.counter1 AS DECIMAL) AS counter1,
CAST(state.reported.counters.value.counter2 AS DECIMAL) AS counter2,
CAST(state.reported.counters.value.counter3 AS DECIMAL) AS counter3,
CAST(state.reported.counters.value.counter4 AS DECIMAL) AS counter4,
CAST(state.reported.counters.units AS STRING) AS units,
CAST(state.reported.location AS STRING) AS location
CAST((state.reported.timestamp) AS STRING ) AS TIMESTAMP
FROM '$aws/things/WebHMI_Dnipro_1/shadow/update'
As result, every single MQTT upload will trigger IoT Rule (to process new entries from WH script, such as counters and location e.g. should be SQL rewritten)to put data to DynamoDB. The next step is to create a Lambda function, that will put data to visualisation dashboard Kibana on ElasticSearch instance.
Create a DynamoDB to Elasticsearch bridge using Lambda function
There is a uploadable code with function, written on Node.js v10.
Import it to AWS Lambda and test. Update roles with appropriate policies.
To test let's create a predefined DDB Upload test event.
If it is successful, let's post smth in WH, to update IoT Core Shadow, which will cause IoT Core Rule processing with SQL-like query, and append shadow in the DDB.
Append to DDB should triggers that new Lambda function, which will repost the data to ElasticSearch instance. To check it, just go to Kibana and click search button. If there is no data in one minute after posting from WH, so something get wrong. The more likely with IAM. There is a CloudWatch logs to investigate problem.