Table of Contents
Setup resource meters and consumption analysis
Data setup required for consumption analysis
Meters setup
In the WebHMI project it is possible to mark some registers as resource meter readings. Then in the Level2 reports various reports regarding resource consumption will be available.
In the register's properties tab, there is a special Resources tab for this:
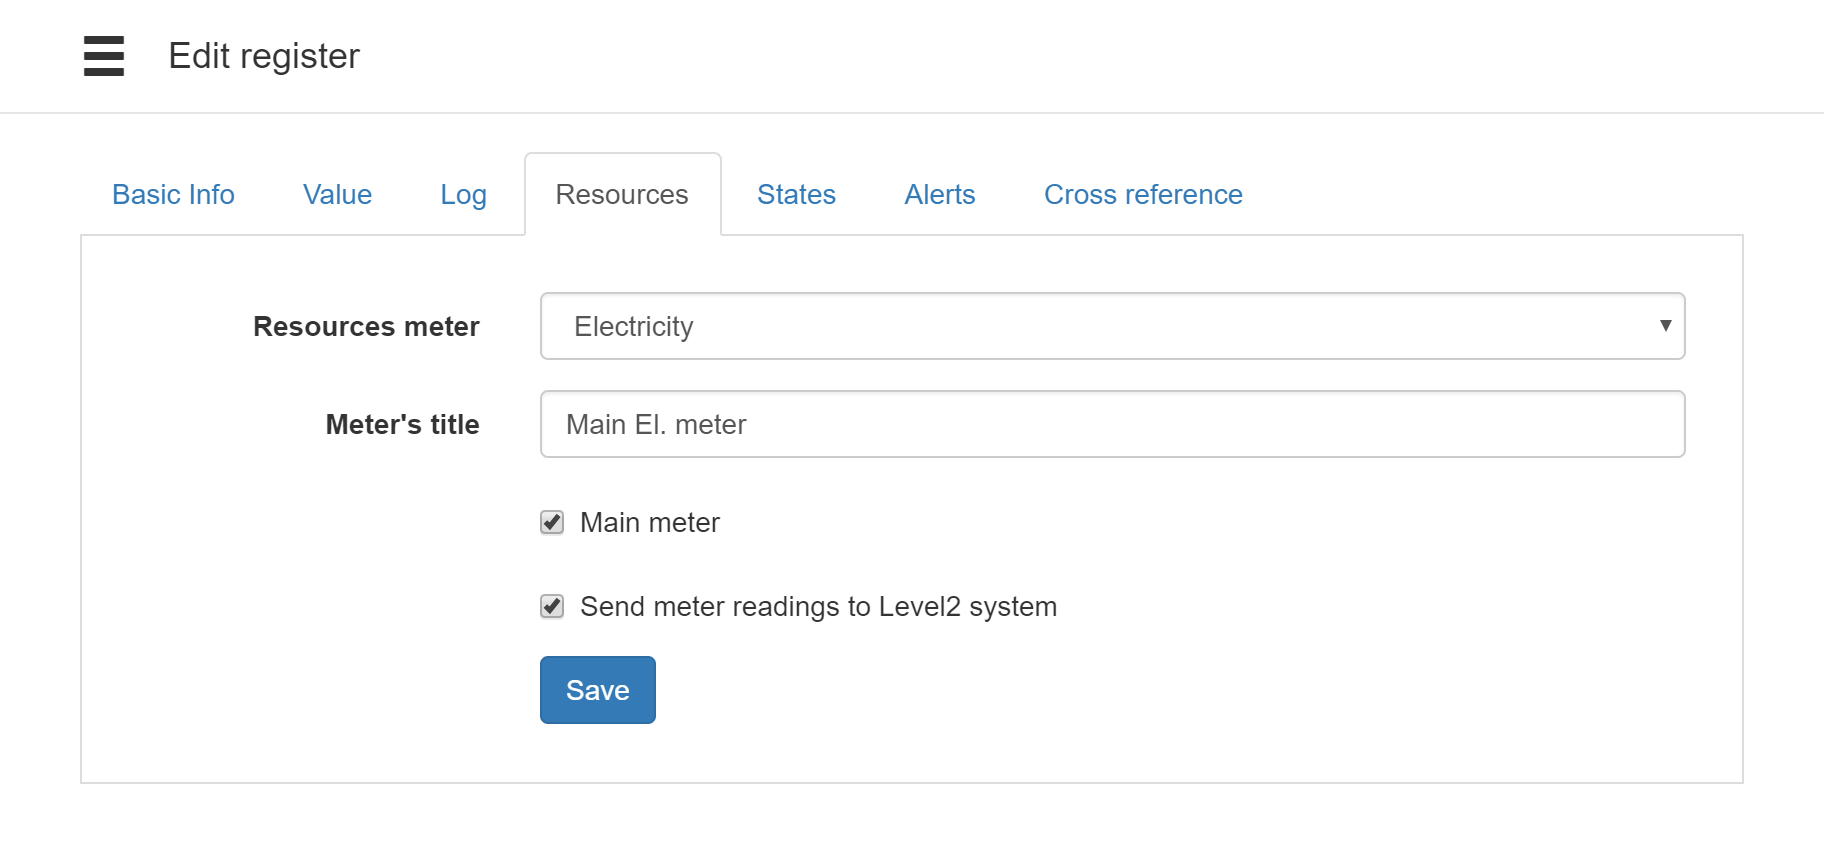
You can choose meter resource:
- Electricity
- Gas
- Heat
- Water
- Hot water
Title: this meter name will be shown in the L2 reports.
Main meter: If the meter is selected as Main, then other meters of the same type will be considered as contributors to the whole resource consumption.
Send meter reading must be checked for using resource reports in Level2.
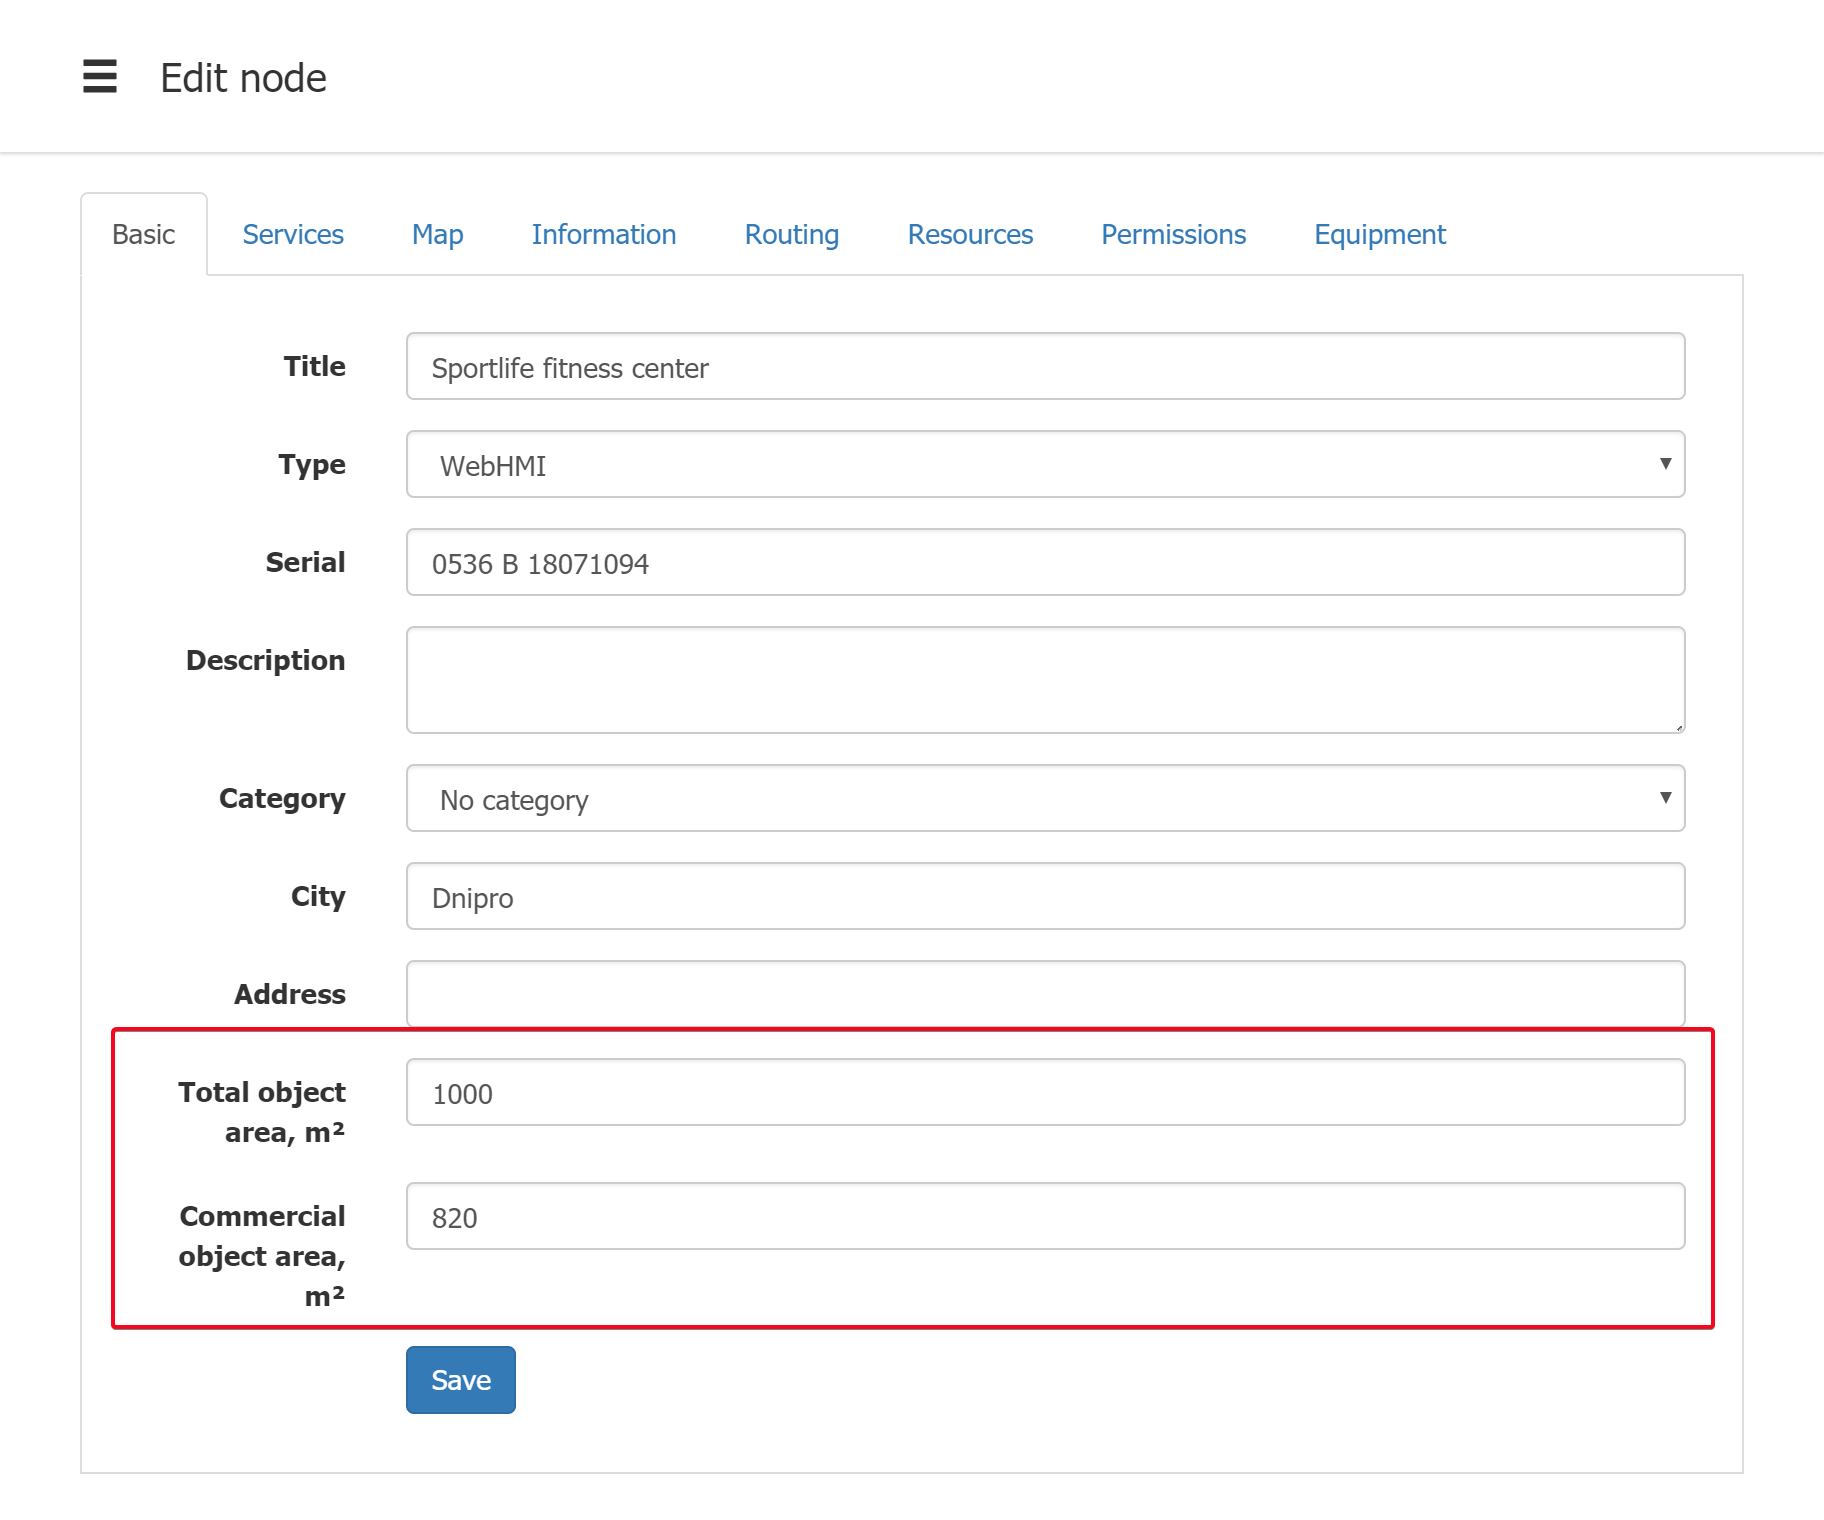
Object area
When the facility being monitored has data on its square you can extimate resource consumption per square meter of total area or commercial area.
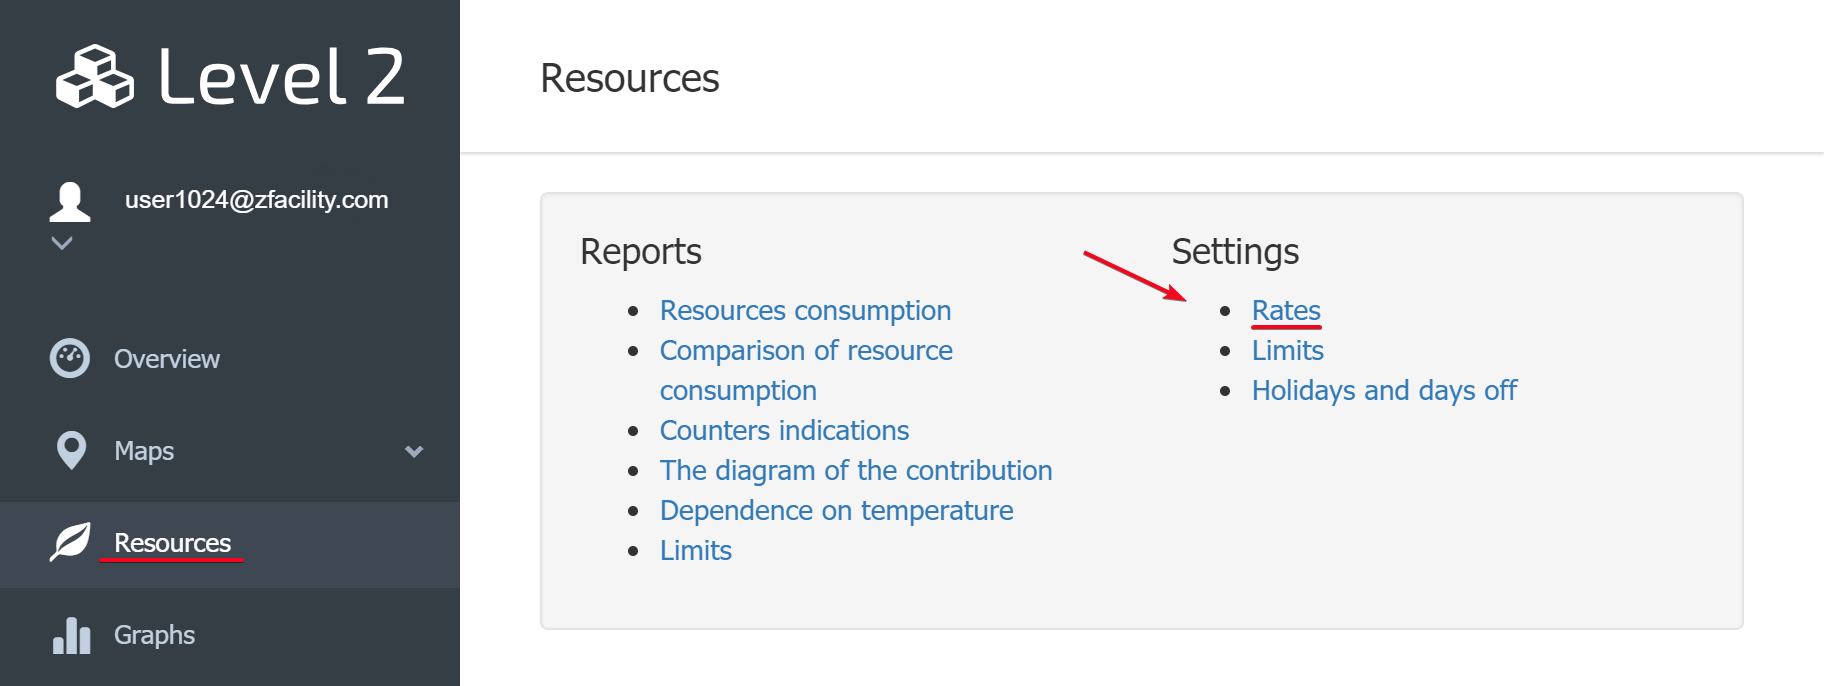
Rates
The consumption figures can be shown both in engineering units and in money units. For this, you should setup rates and link them to the resource. Then in the consumption reports you will see correct figures in money units.
Use Add button to add new rate:
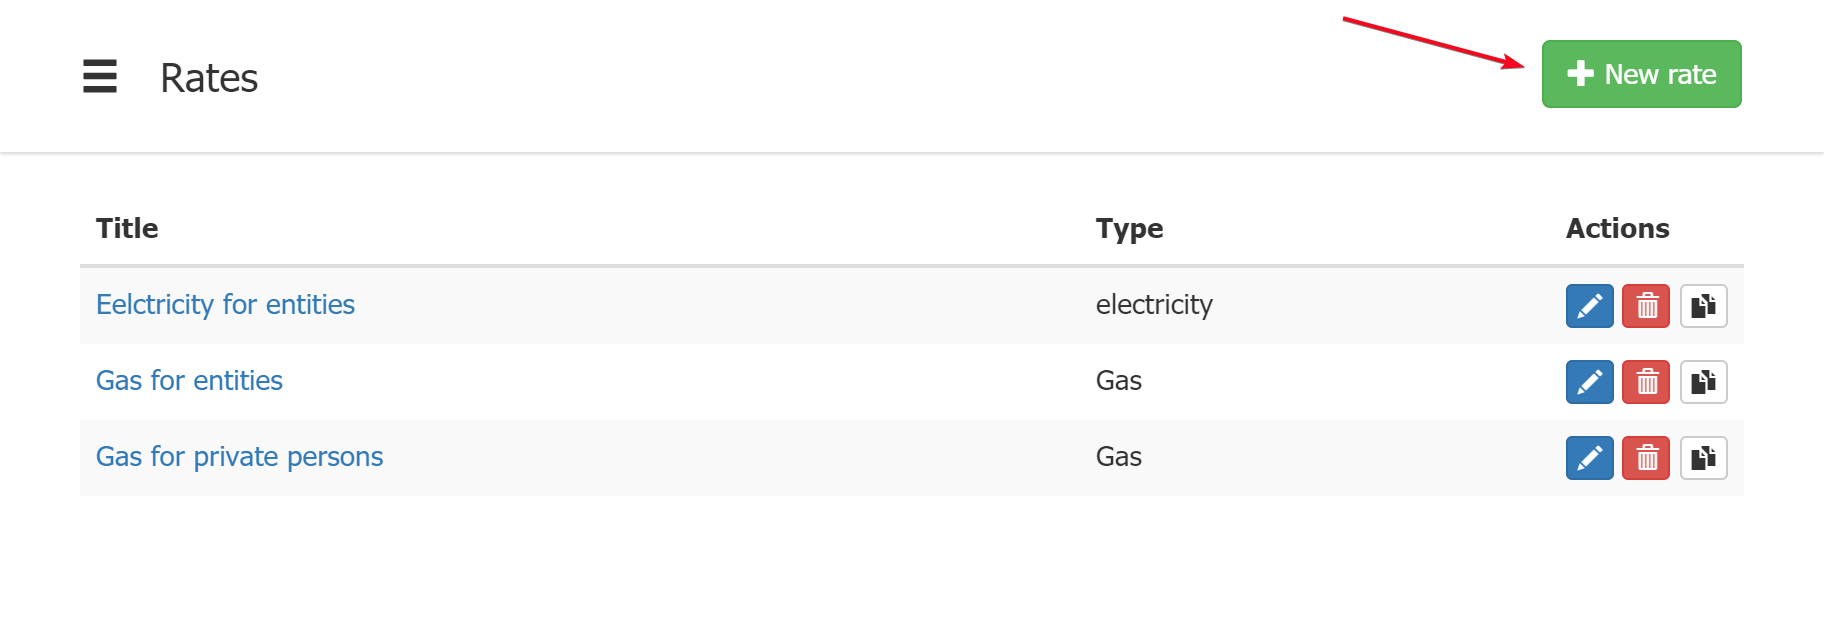
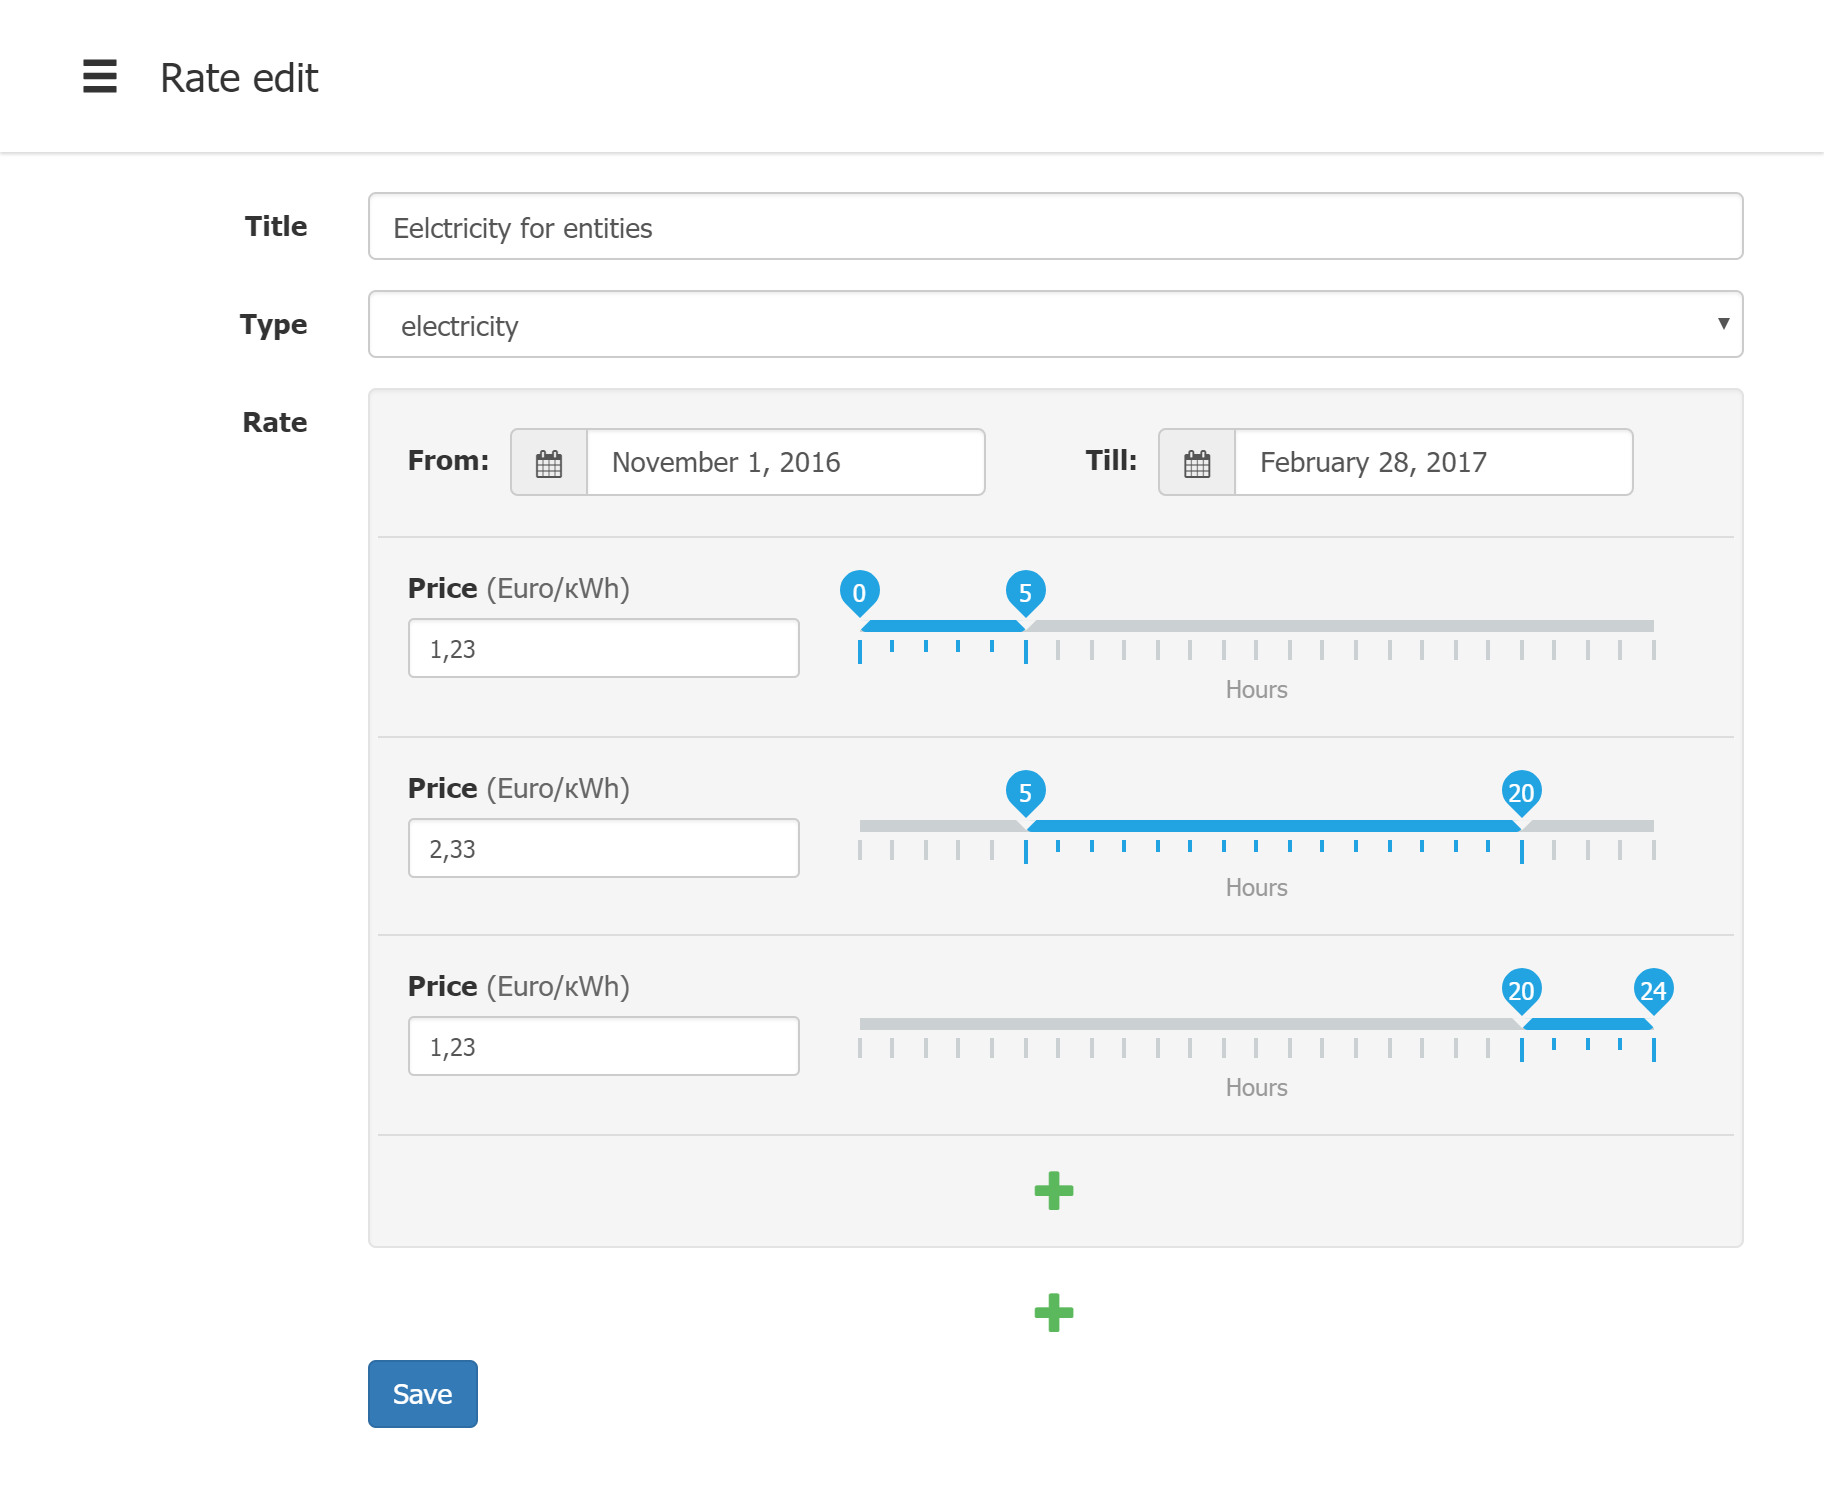
On the rate edit page, you setup:
- Rate title for rate list
- Select type(category) of the resource to be calculated under this rate
- Select dates of the time period this rate is applied
- Enter prices and daytime this price is valid (there maybe several tariffs for day/night time etc.)
Then in the node setup, select necessary rate for the resource you want to analize:

Specifying the node location on a map
After WebHMI node is pinned to a specific map location in its setup page:
- It will be shown in correct location on a map with colorizing (reflecting current state), provided it has been attached to this map with status register linkage.
- Weather data for this location can be passed to WebHMI and used in Lua programs. More on this
- Mean temperatures for that location will be used to generate resource consumption vs. temperature report. More on this...

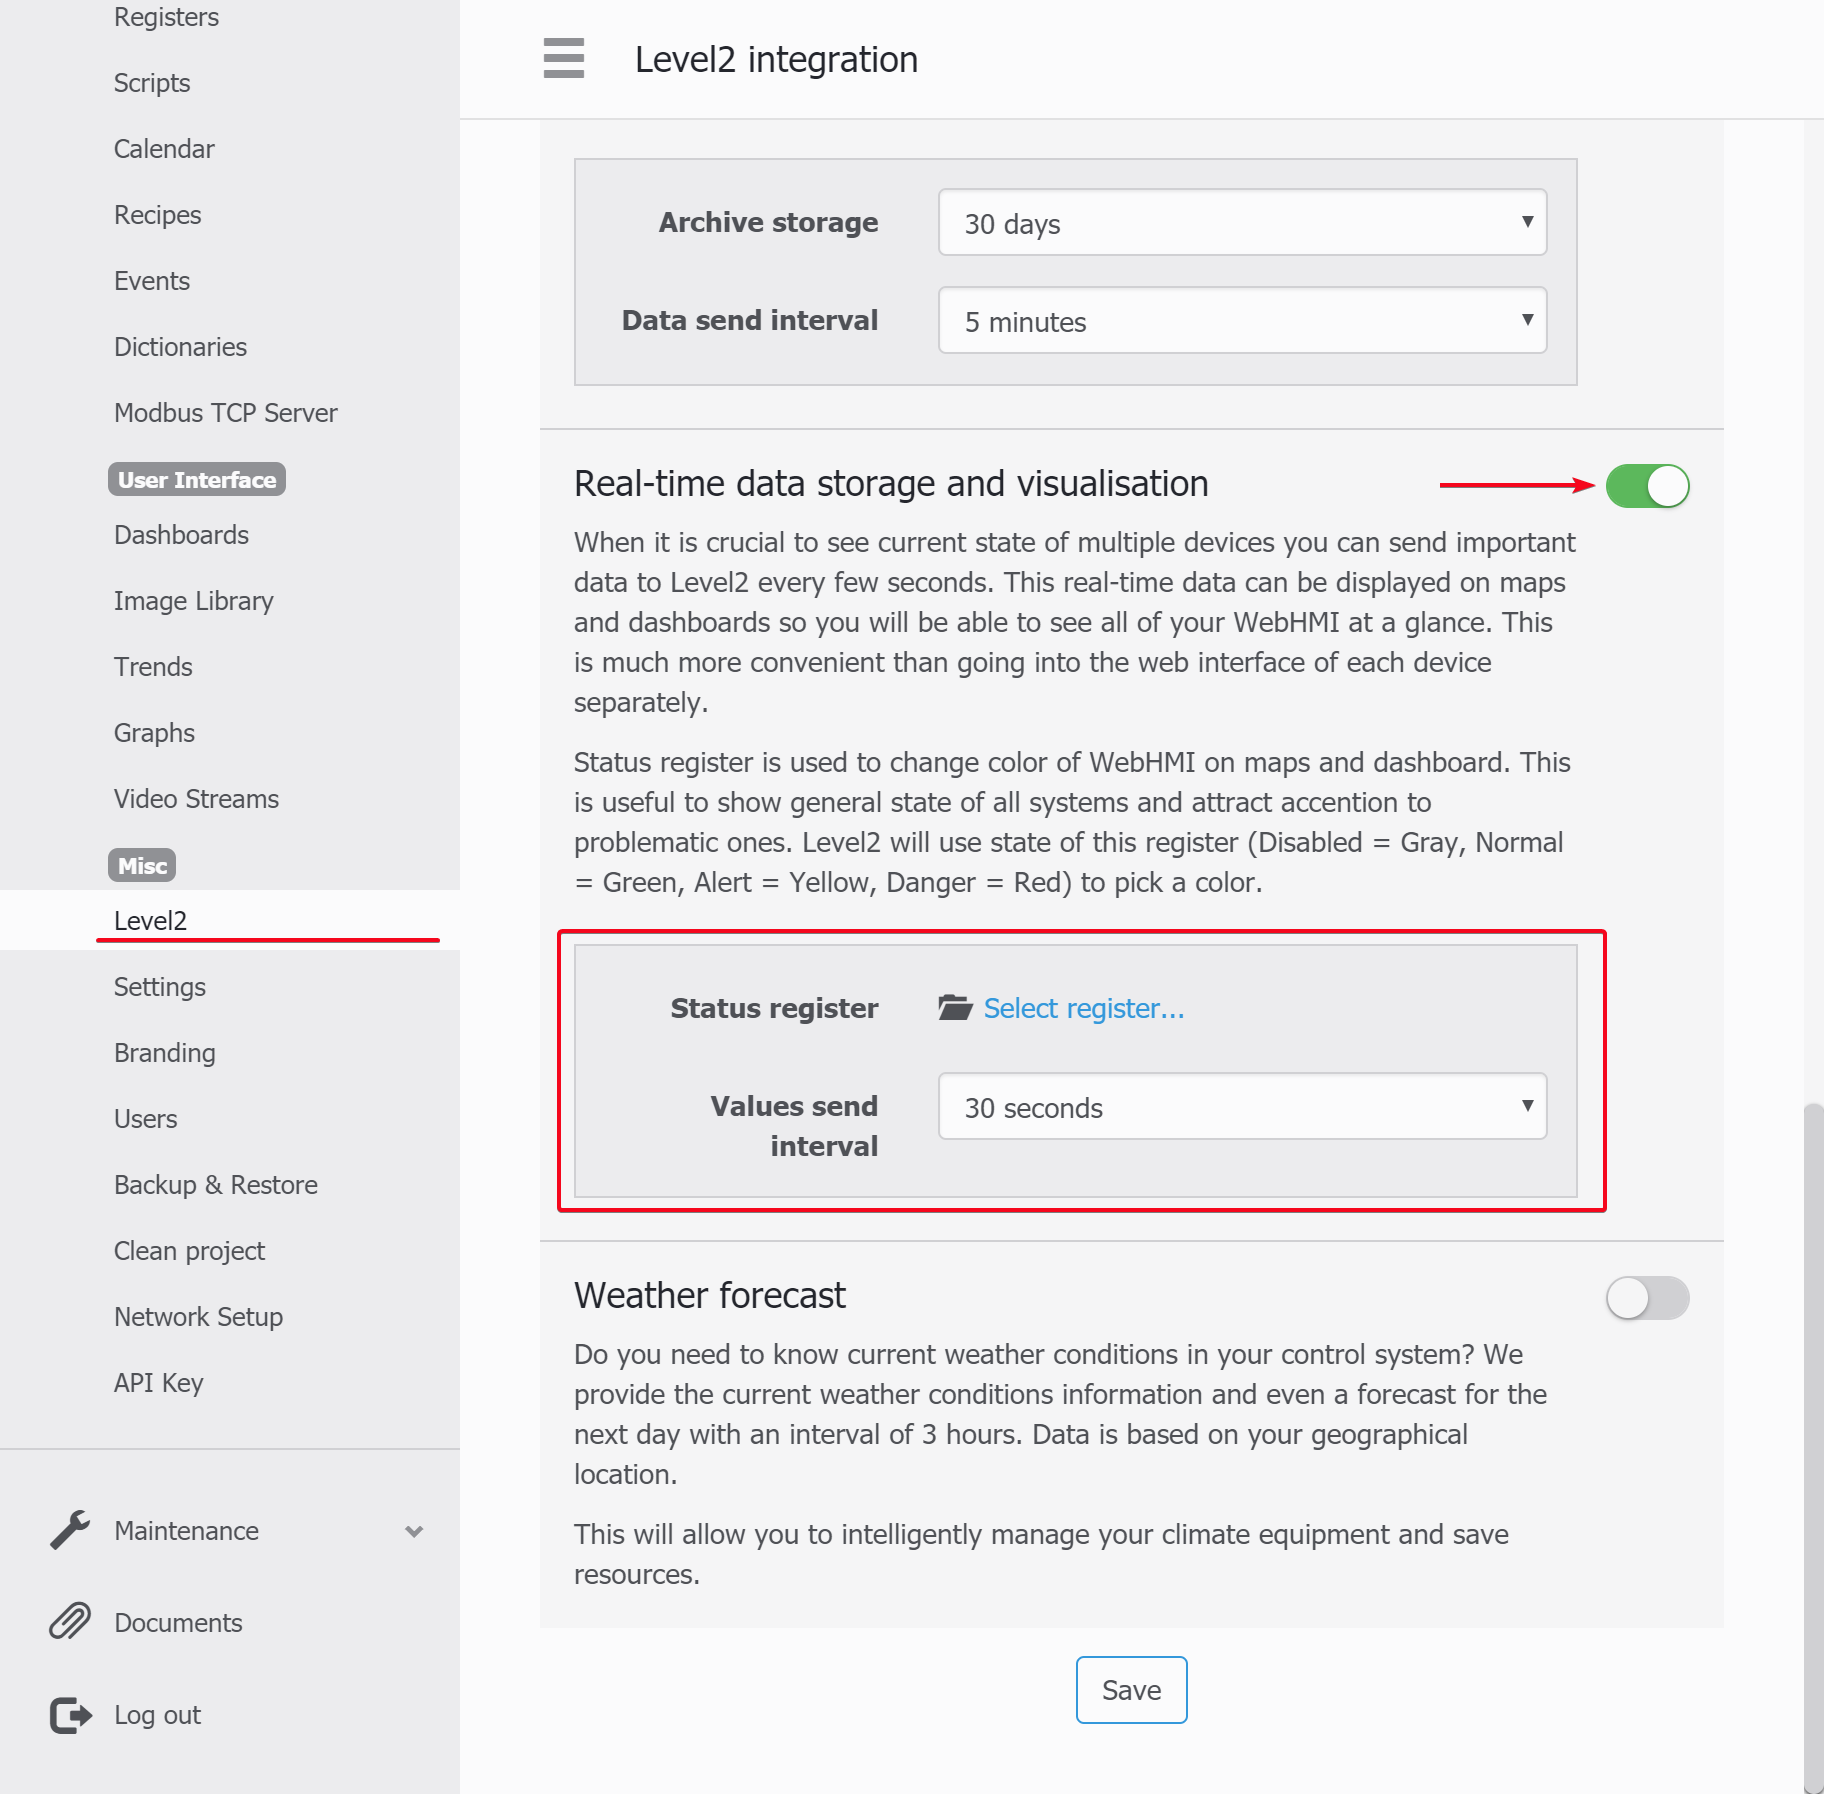
Node location and status register linkage is set on the node's setup Map tab:
- Location is specified just by clicking on a map
- Register with status (1) - this register for showing current node state (normal, alert etc.). These states have to be processed in the WebHMI project. Then the node will have the color corresponding to its state1). The register should have the “Send real-time data to Level2 system” checkbox enabled:
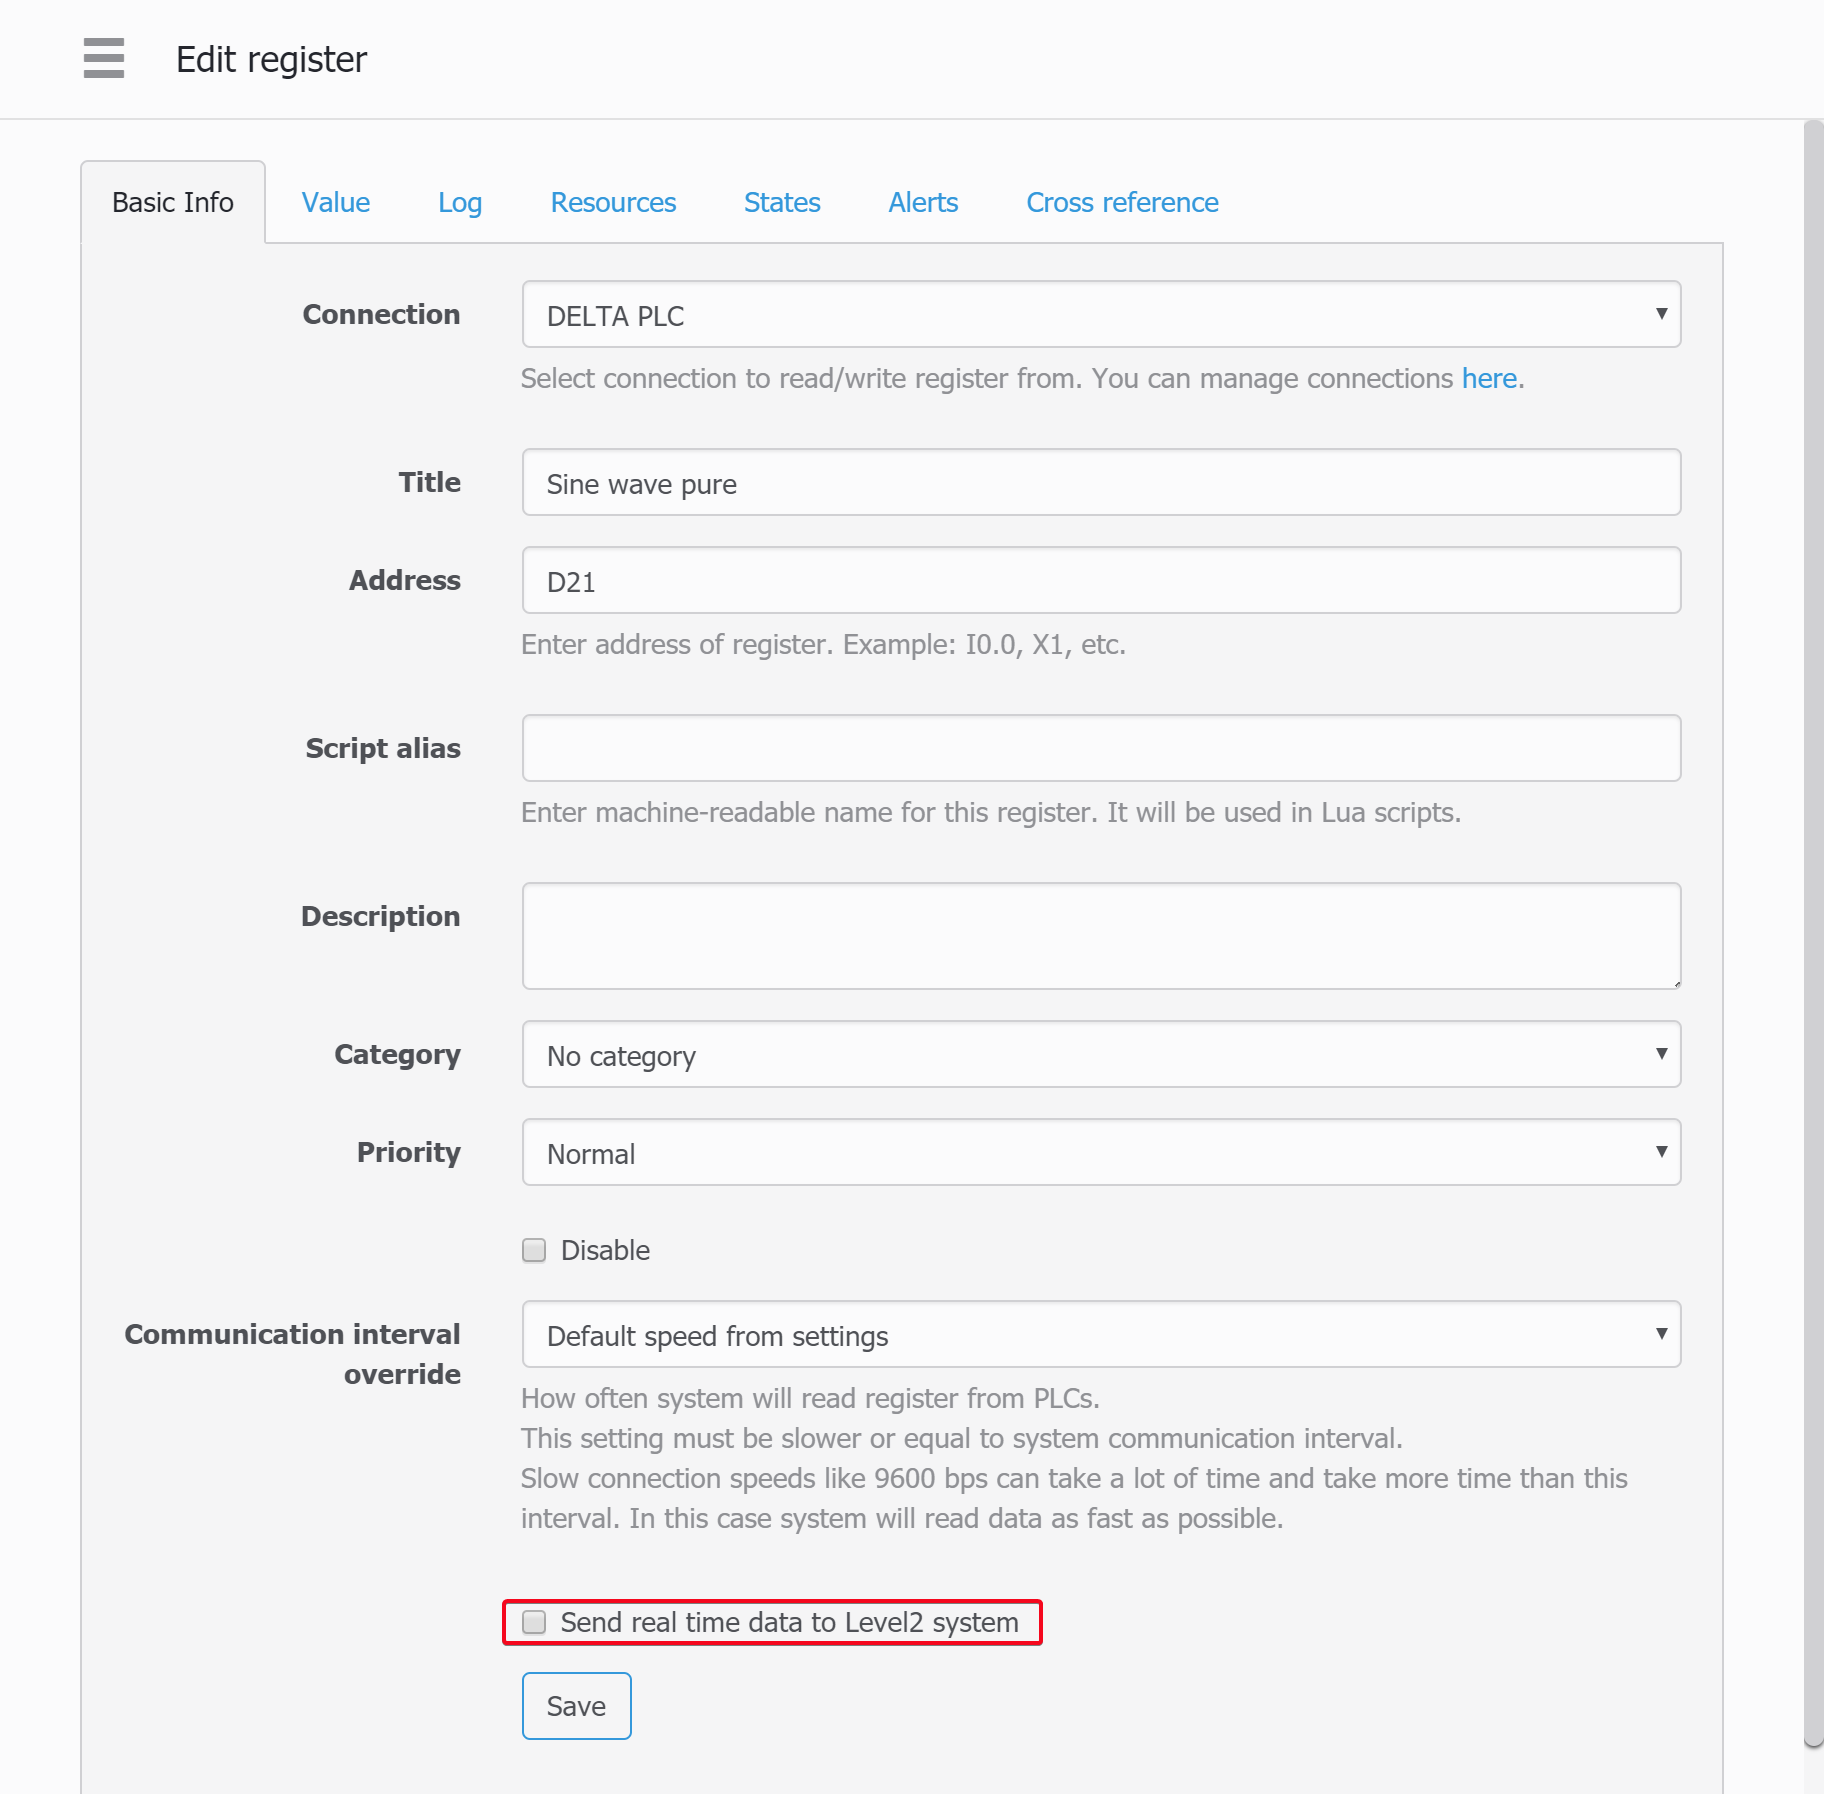
You can select status register from this Level2 - Node setup - Map page or right on the WebHMI from its Level2
menu:
- Show registers data(2) - these extra register value's can be shown in the node icon on a map. You may change the title to display and units for it here. “Show under the cursor” checkbox set will hide these value and show when the cursors hovers above the node icon.
Resources consumption analysis
In this report you can view consumption data for a given resource at some facility over the period of time. If there are many meters for the resource, their individual shares in total consumption can be shown. Below the example of this report.
It is available on the following link:

In this report you select:
- Node - WebHMI node with the resource meters you want to analize
- Resource type - specific resource from the list of available
- Report type - select a time base, to take monthly, weekly, daily, hourly totals for meter readings
- Specific meters - choose resource meters
- Extra parameter - to see how consumption relates to some other parameter, like temperature, humidity etc. you select this extra parameter(provided it is saved to graph log data)

You can also analize the cost spent for some resource by switching this button:

Built report can be printed or saved to Excel sheet.
Other types of consumption analysis in Level2
Comparison of resource consumption
It is based on previous, but for comparing two similar systems. See more on this More details .
Counters indications
It is simplest report to show meters readings over the periods of time. More details ...
The diagram of the contribution
In this report, all nodes consuming a certain type of resource can be shown with their respective contribution to the total consumption. The report shows total consumption or per square meter of a building.

Dependence on temperature
In this report consumption chart is shown as a function of temperature. More details...
Limits
When there are limits set for the resource consumption, this report will show how current consumption for the period fits to the planned limit for this period. More details ...