download-csv-js
This is an old revision of the document!
Table of Contents
Example of graph data download with JS for dashbaord
The standard method of exporting data from graphs to XLS, HTML, CSV files has the resolution of the selected view on the respective graph, not all data - due to performance issues. Please refer to the API article on how to retrieve data with REST requests.
In the following example, dashboards' JS scripting option is presented.
Dashboard layout
There are 4 control elements on the dashboard you must provide:
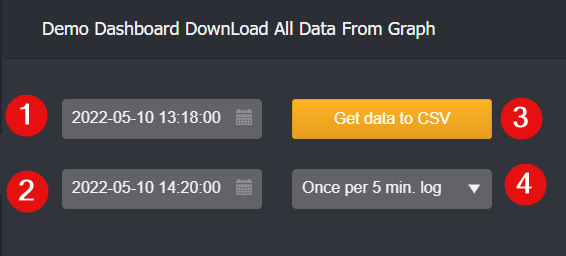
- Start time date picker
- End time date picker
- Button for invoking the JS script
- Dictionary element for selecting one of the many graphs you may have. E.g. if you have graphs with IDs of 1, 2, 3… you have to create a dictionary of 1, 2, 3…. and bind it with the register that will be used for the element on the dashboard.
Script
Put the following script into the 'Script' tab of the dashboard properties
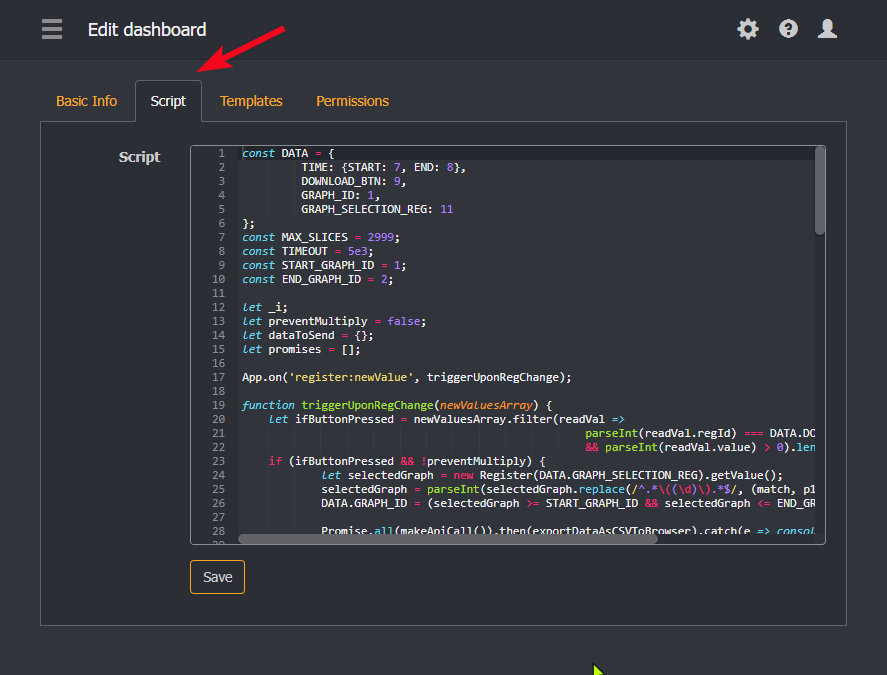
const DATA = {  // constant names for accessing the dashboard selection
         TIME: {START: 7, END: 8},   // start and end time register ids
         DOWNLOAD_BTN: 9,            // register to detect if the button was pressed
         GRAPH_ID: 1,                // placeholder for the graph id that
         GRAPH_SELECTION_REG: 11     // will be selected by selection register
};
const MAX_SLICES = 2999;             // max number of the slices in the graph data api call
const TIMEOUT = 5e3;
const START_GRAPH_ID = 1;            // start number of the range for graphs ids
const END_GRAPH_ID = 2;             // end number

let _i;
let preventMultiply = false;
let dataToSend = {};
let promises = [];

App.on('register:newValue', triggerUponRegChange);

function triggerUponRegChange(newValuesArray) {
    let ifButtonPressed = newValuesArray.filter(readVal =>
                                                    parseInt(readVal.regId) === DATA.DOWNLOAD_BTN
                                                    && parseInt(readVal.value) > 0).length > 0;
    if (ifButtonPressed && !preventMultiply) {
            let selectedGraph = new Register(DATA.GRAPH_SELECTION_REG).getValue();
            selectedGraph = parseInt(selectedGraph.replace(/^.*\((\d)\).*$/, (match, p1) => p1));
            DATA.GRAPH_ID = (selectedGraph >= START_GRAPH_ID && selectedGraph <= END_GRAPH_ID) ? selectedGraph : 1;

            Promise.all(makeApiCall()).then(exportDataAsCSVToBrowser).catch(e => console.log(e));
    }
}

function getSlicesFromTS() {
    let paramsSet = [];
    calcSlices(parseInt(new Register(DATA.TIME.START).getValue()),
               parseInt(new Register(DATA.TIME.END).getValue()));

    function calcSlices(s, e)  {
        if (s > e) {
            console.log('startTS >= endTS') ; return ;
        }
        if (e - s <= MAX_SLICES)
            paramsSet.push({start:s, end: e, slices: e - s + 1});
        else {
            let newEnd = s + MAX_SLICES - 1;
            paramsSet.push({start: s, end: newEnd, slices: MAX_SLICES});
            calcSlices(newEnd + 1, e);
        }
    }
    return paramsSet;
}

function makeApiCall() {
    let slicesParams = getSlicesFromTS();
    dataToSend = {};
    promises = [];
    preventMultiply = true;
    setTimeout(function(){clearTimeout(_i); preventMultiply = false;}, TIMEOUT);

    slicesParams.forEach(function(paramsSet, i) {
        let promise = new Promise(function(resolve, reject) {
            $.ajax({
                url: "/api/graph-data/" + DATA.GRAPH_ID,
                method: "GET",
                headers: {
                    "X-WH-START": paramsSet.start,
                    "X-WH-END": paramsSet.end,
                    "X-WH-SLICES": paramsSet.slices,
                    "X-WH-REGISTERS": DATA.GRAPH_ID
                },
                dataType: 'json',
                context: this,
                success: function (response) {
                    dataToSend[i] = response;
                    resolve();
                },
                error: function (result, text, error) {
                    reject(text);
                }
            });
        });
        promises.push(promise);
    });

    return promises;
}

function exportDataAsCSVToBrowser() {
    let response = [];
    Object.values(dataToSend).forEach(dataSet => {response = response.concat(dataSet)});
    if (response.length > 0) {
        let rep = [];
        let header = ['Time'];
        let regs = WebHMI.graphs[DATA.GRAPH_ID].regs;
        regs.forEach(function(reg) {
            let vv = reg.title.replace("\"", "\"\"");
            header.push('"' + vv + " - Min" + '"');
            header.push('"' + vv + " - Avg" + '"');
            header.push('"' + vv + " - Max" + '"');
        });
        rep.push(header);
        response.forEach(function(dataSet) {
            let row = [moment(dataSet.x).format("YYYY-MM-DD HH:mm:ss")];
            regs.forEach(reg => dataSet[reg.id].split(';').forEach(value => {row.push(value)}));
            rep.push(row);
        });

        if (window.navigator.msSaveBlob) { // IE
            let blobObject = new Blob([rep.join("\r\n")]);
            window.navigator.msSaveBlob(blobObject, WebHMI.graphs[DATA.GRAPH_ID].title + '.csv');
        } else {
            let a = document.createElement('a');
            a.href = 'data:attachment/csv,' + encodeURIComponent(rep.join("\r\n"));
            a.target = '_blank';
            a.download = WebHMI.graphs[DATA.GRAPH_ID].title + '.csv';
            a.style.visibility = "hidden";
            document.body.appendChild(a);
            a.click();
        }
    }
}
download-csv-js.1652184239.txt.gz · Last modified: 2022/05/10 12:03 by emozolyak