Object array visualization tip
There is a limit in the dashboard object size due to certain performance issues (not more than 199 elements or more than 400000 bytes)). Sometimes users need a very big and rich dasboard visualization, which may lead to excceding this limit.
In this cases, some optimization trick maybe used. Following are the examples of such extensive dashboard graphics:
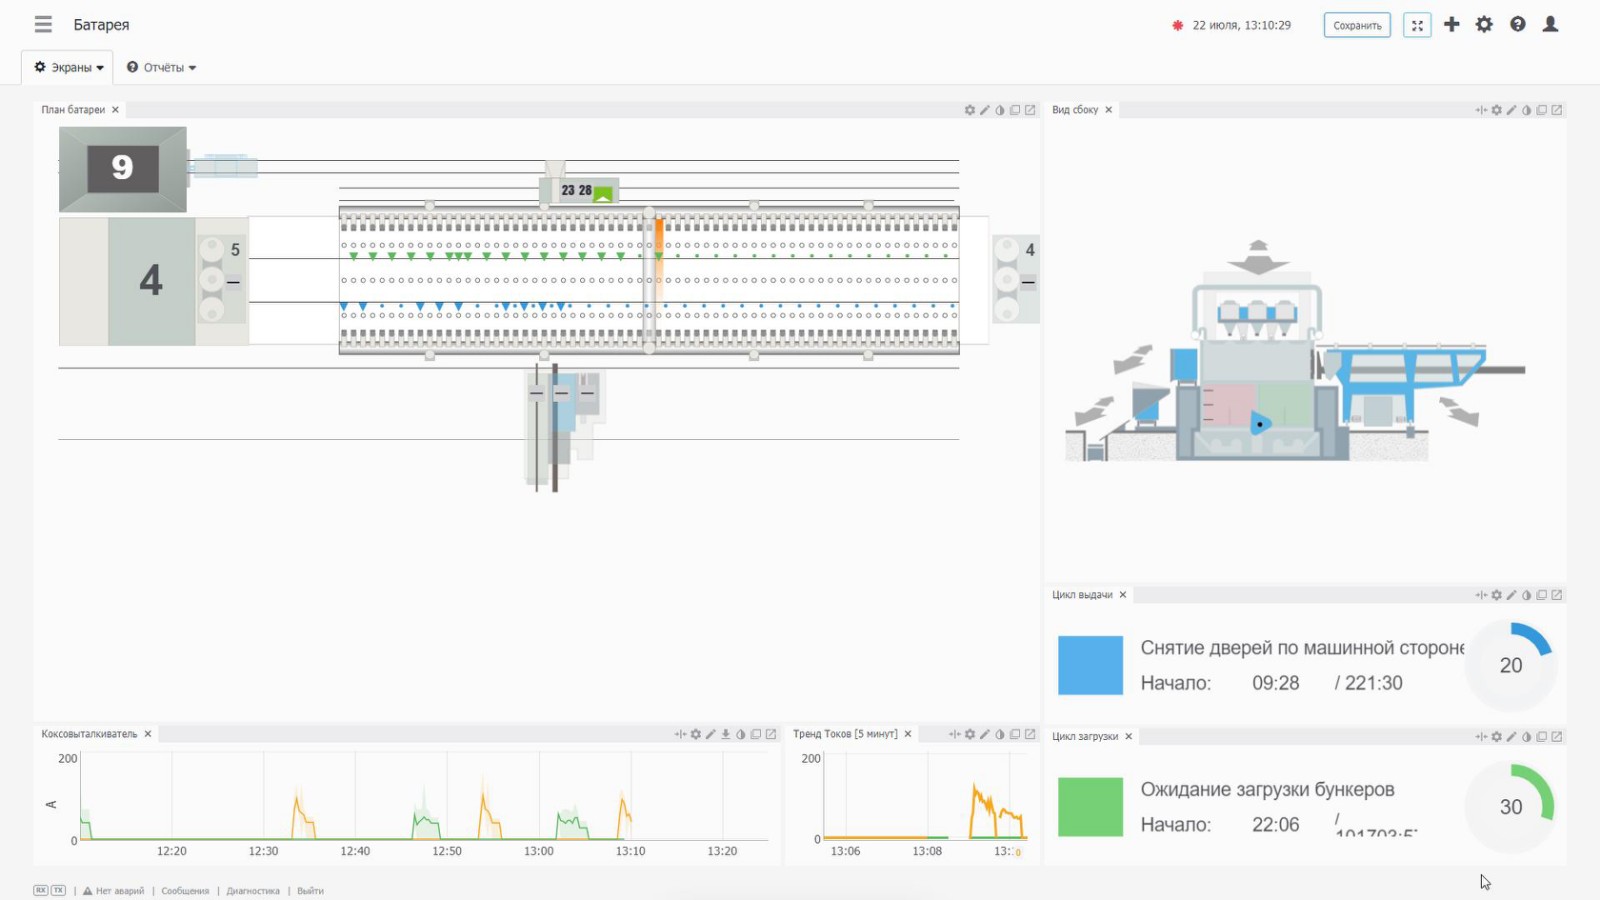
Example 1 - coke furnaces complex
Along the raw of ~60 furnaces, a process state needed to be shown in the furnace place, from both sides, which means ~120 graphical objects.
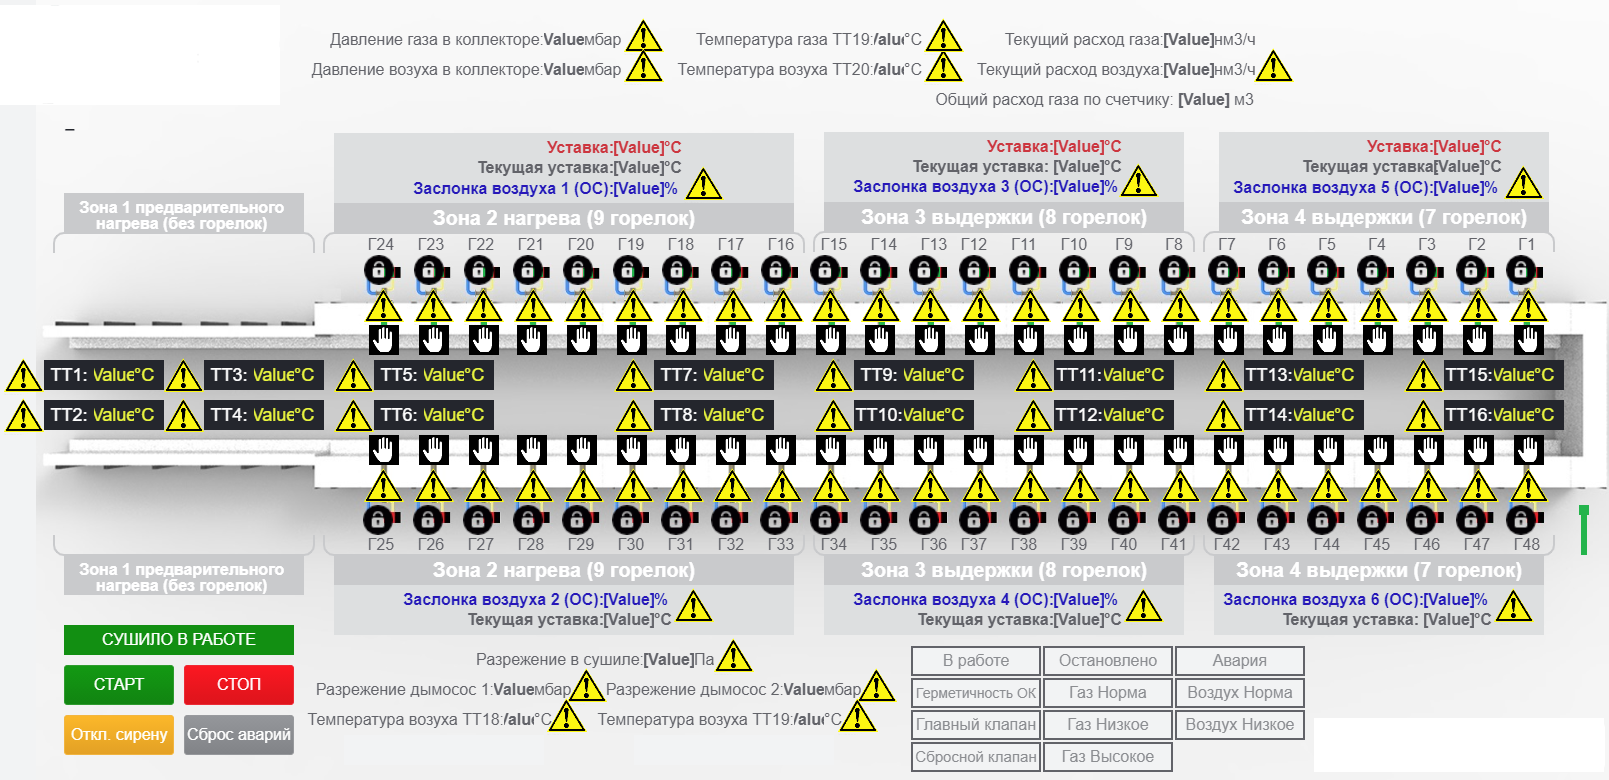
Example 2 - big drying furnace
There is an array of burners inside the furnace, each of the burner requires a set of binary indicators, which require a huge amount of visualization elements.
The solution
The solution was to pack all the elements into one string object, with each character reflecting the state of the respective process object.
The idea is shown on the following gif images:
The code which makes the trick
TRUE_SYMBOL =  '⚠'
FALSE_SYMBOL = '-'
NUMBER_OF_SPACES = 2

function main (userId)

   local bit_mask = R("demo_mask")
   local t = {}

   for b = 8, 1, -1 do
        local symbol = hasbit(bit_mask, b) and TRUE_SYMBOL or FALSE_SYMBOL
        table.insert(t, symbol)
   end

   local out = table.concat(t, string.rep(' ', NUMBER_OF_SPACES)) ; INFO("result_table: " .. out)

   U("demo_string", out)
end

-- HELPERS --
function bw(n)
    return 2 ^ (n - 1)   -- returns weight of the bit in pos. n
end

function hasbit(x, b)
  local p = bw(b)
  return x % (p + p) >= p  -- returns if b is true/false; if hasbit(value, b) then ...
end

function U(reg, new_value)
    local cur_value = R(reg)
    if cur_value and new_value and (cur_value ~= new_value) then
        WriteReg(reg, new_value)
    end
end
Using the font size and spacing adjusment in the lua script you can get necessary dimensions of this object.