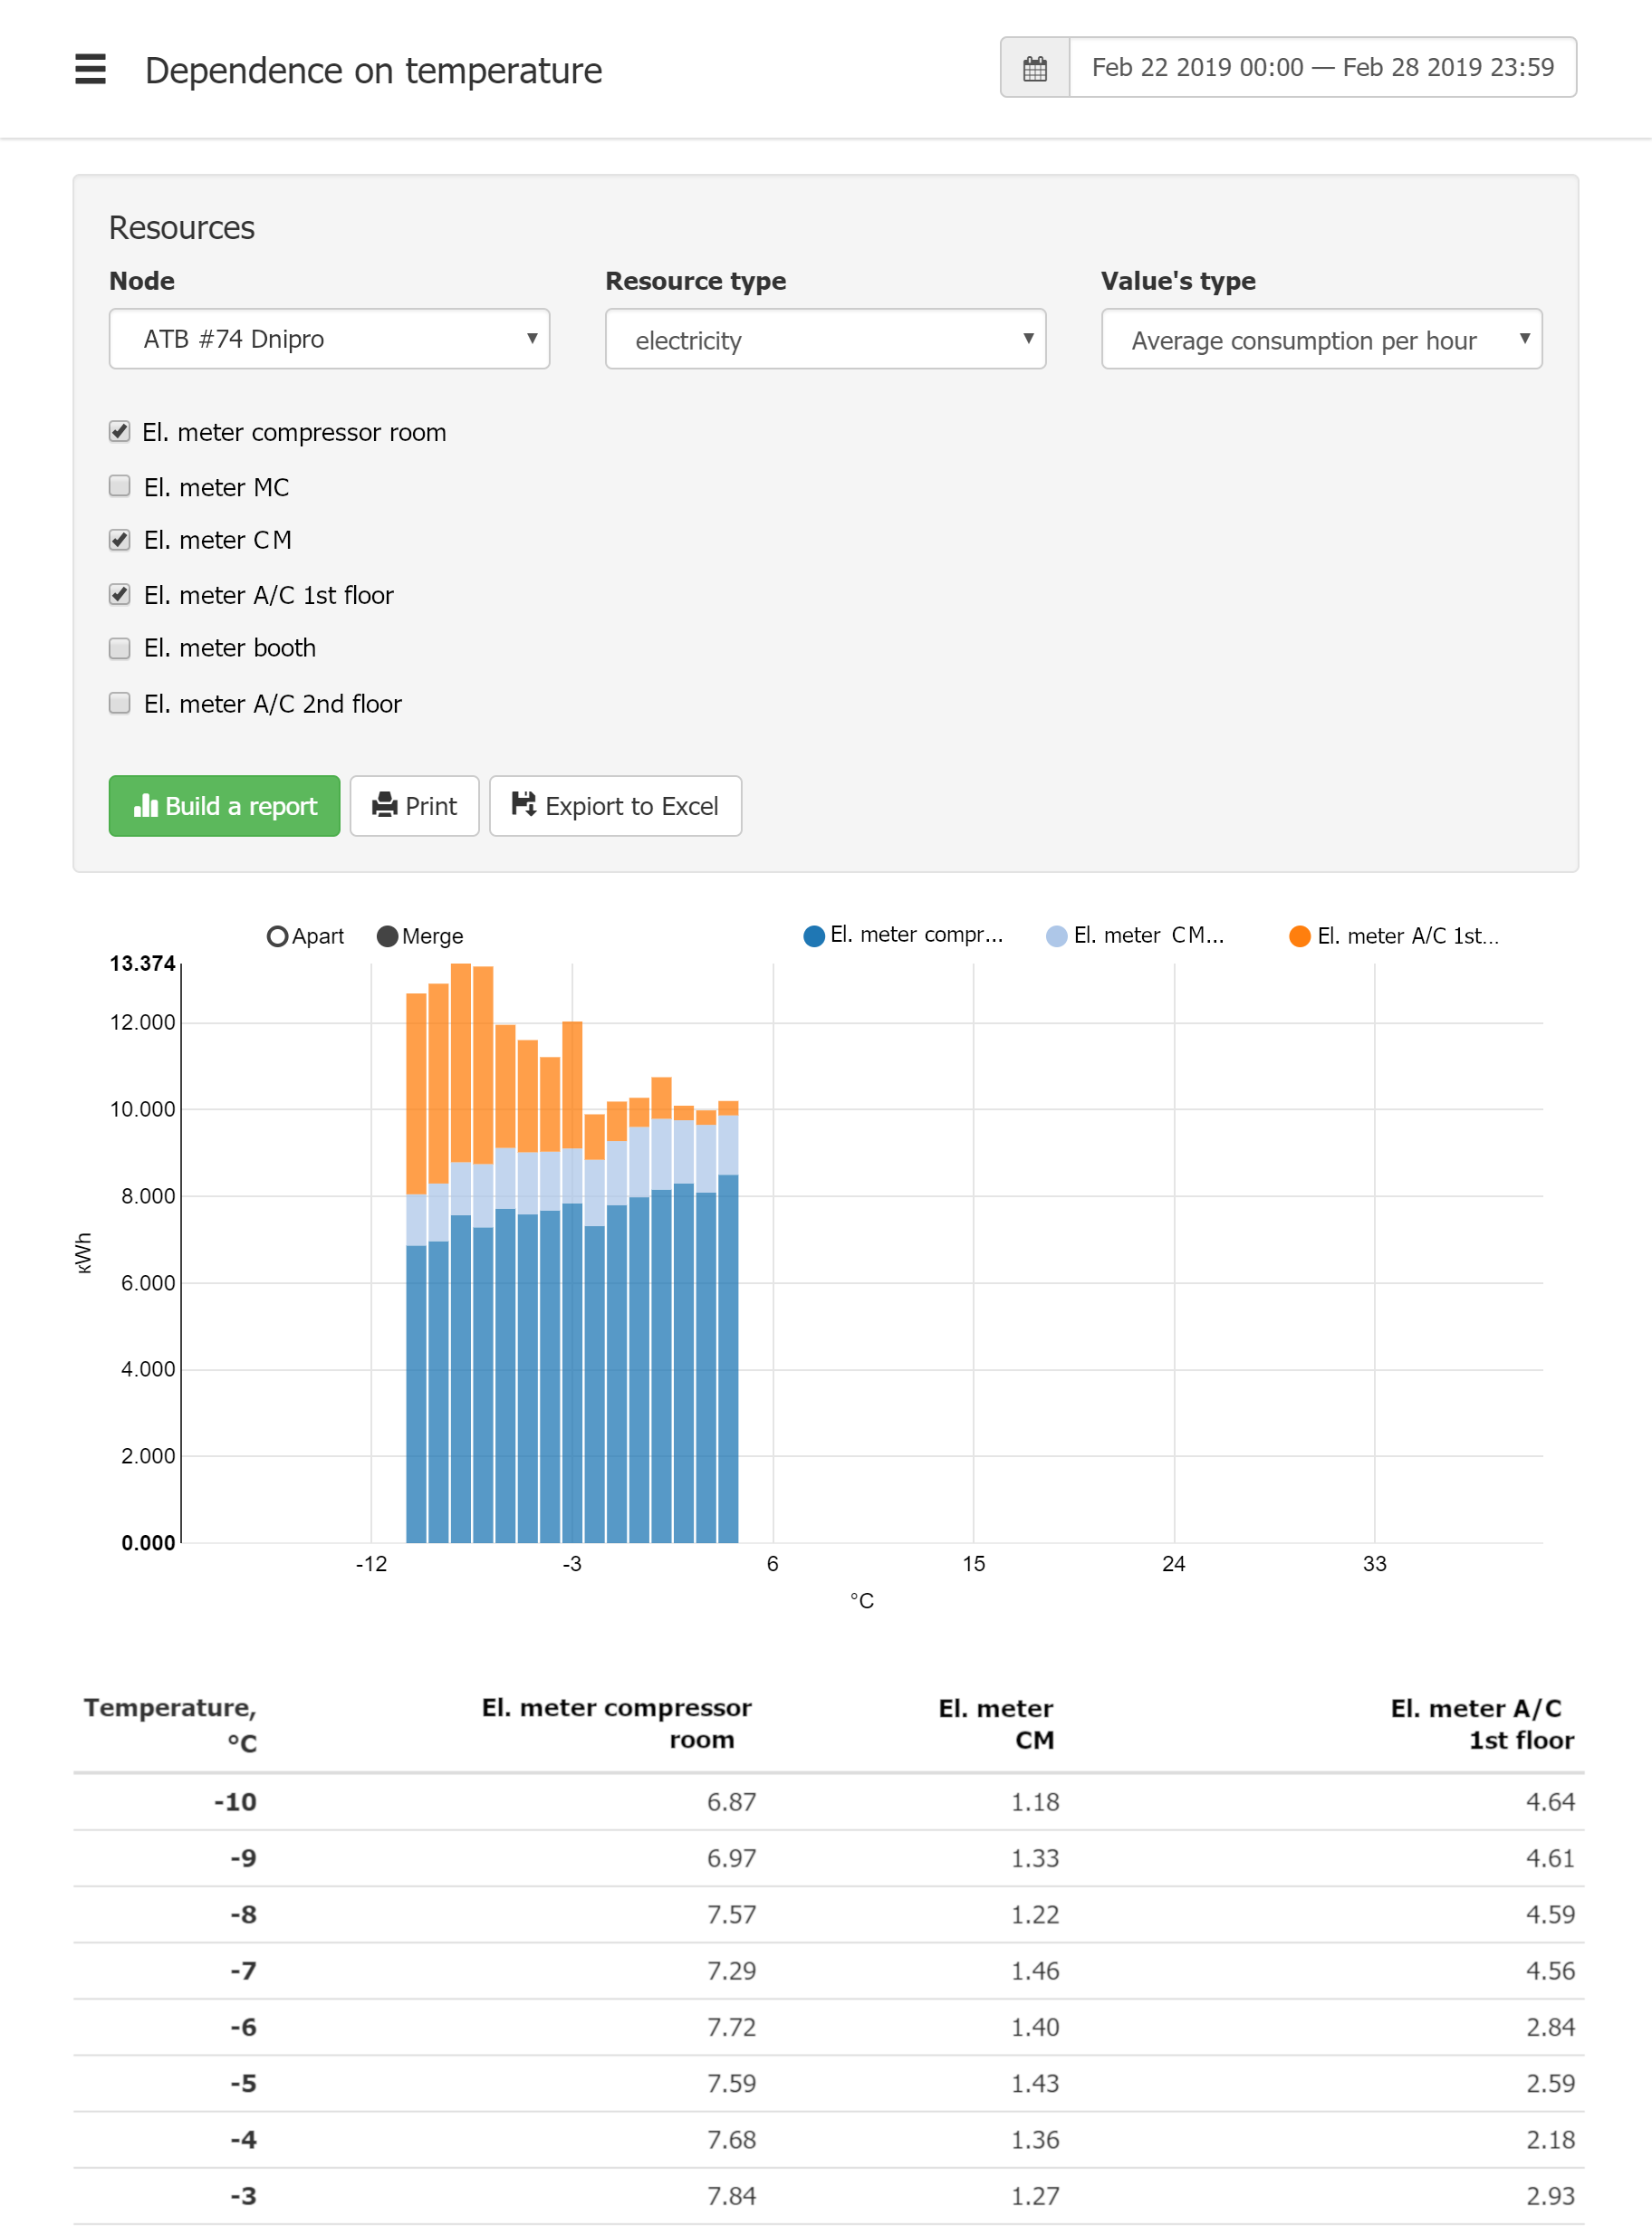
Temperature-dependent resource consumption analysis
This report show how the resource consumption is related to temperature deviations.
The mean temperature value for the given time period is taken from the weather database for the map location where the WebHMI node is pinned to.

Then you can choose:
- WebHMI node
- Resource type with their respective meters
- Value's types
- Average consumption per hour
- Average per m2
- Average per m2 of the commercial area
- Total consumption
- Total consumption per m2
- Total consumption per m2 of the commercial area
The built report looks like this:
 The chart can be viewed in two vairiants:
