Table of Contents
![]()
Historical graphs
Historical charts (hereinafter simply graphs), unlike trends, allow you to save your data in an database log.
To create a graph, you need to select the menu item Setup / Graphs. The creation interface here is the same as for Trend, with one exception - only registers with the option 'Save data for graphs' set will be displayed in the register list (see work with registers ). See more on this here.
When there are graphs configured, they appears in the Analytics / Graphs menu.
An example of a graph is shown on the following pictures:
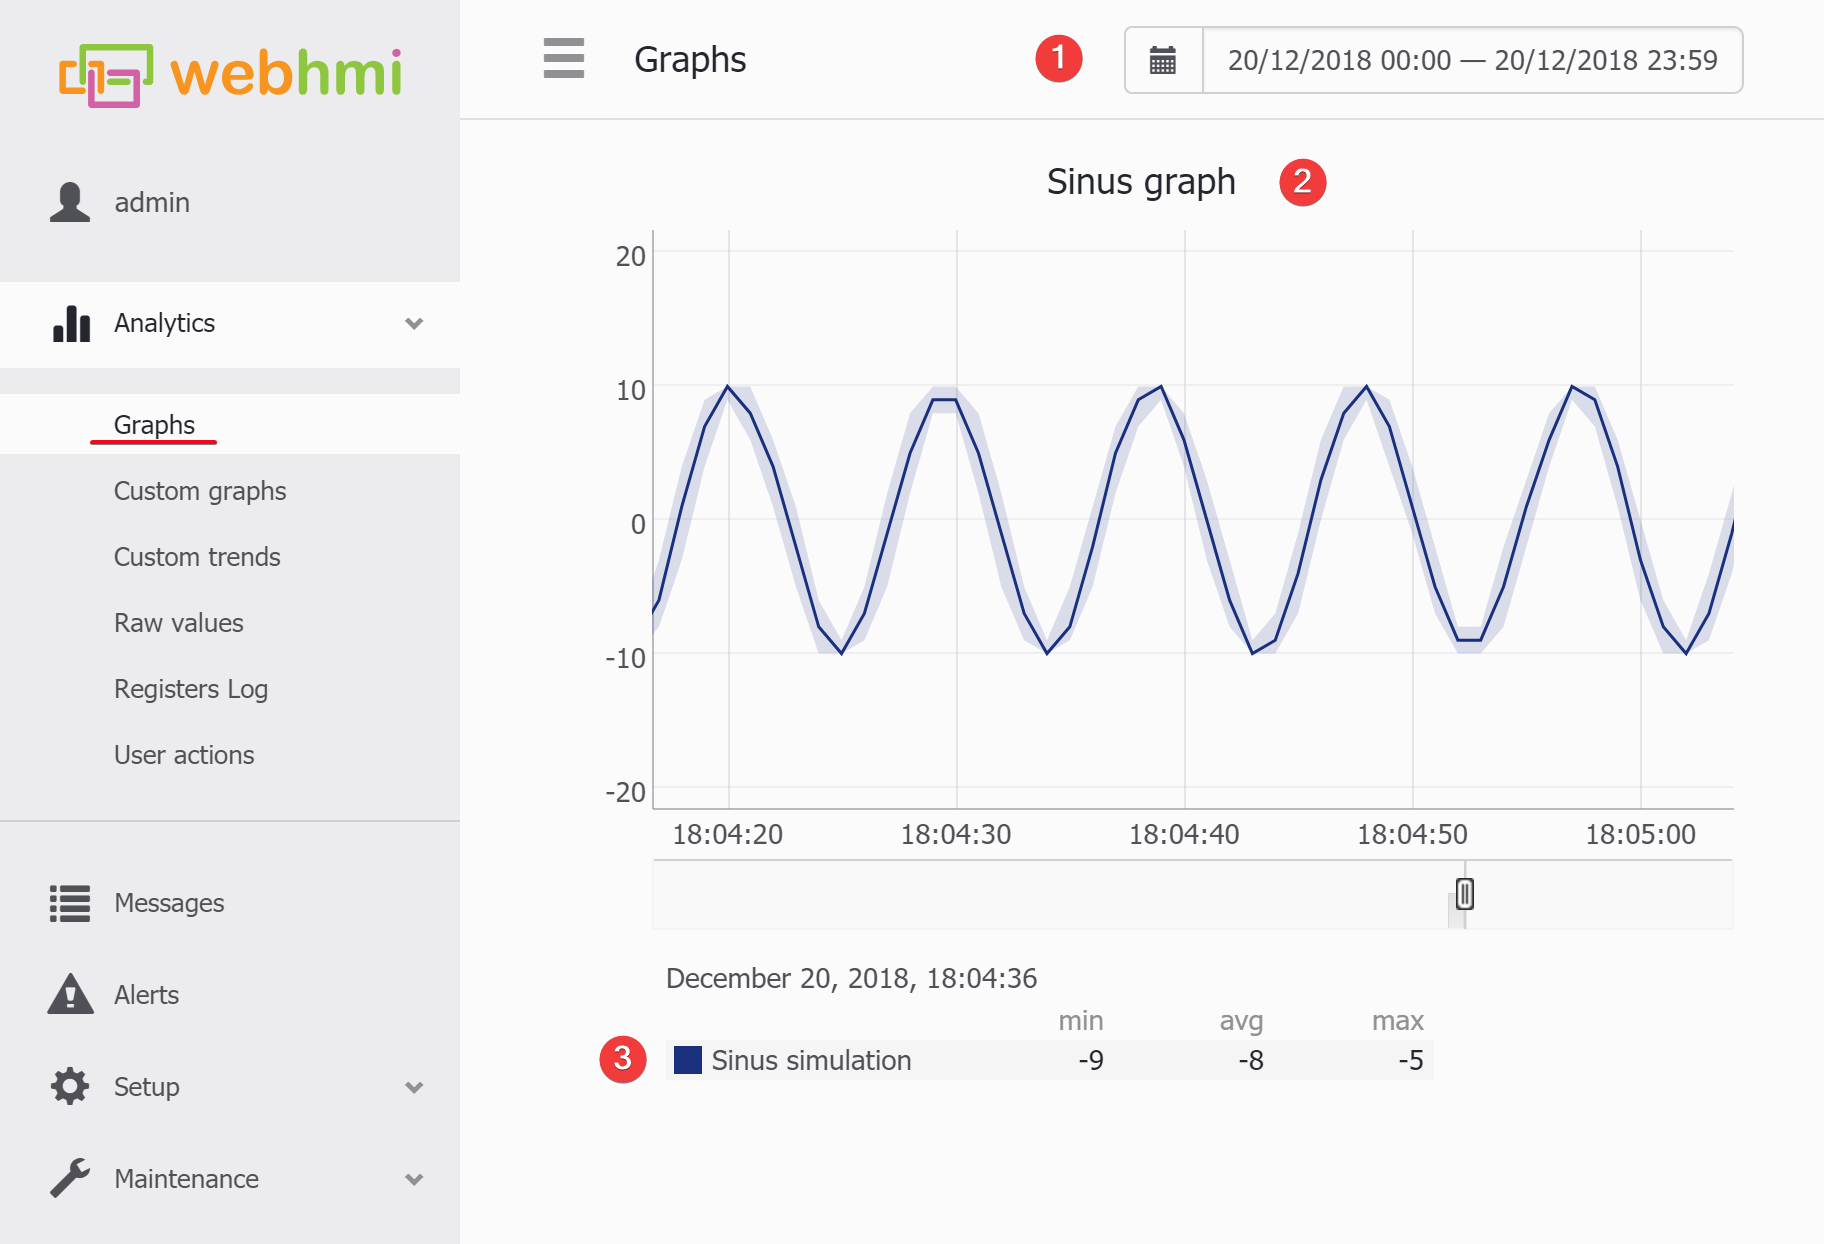
This one is shown on a small time scale:
This one is shown on a large time scale:
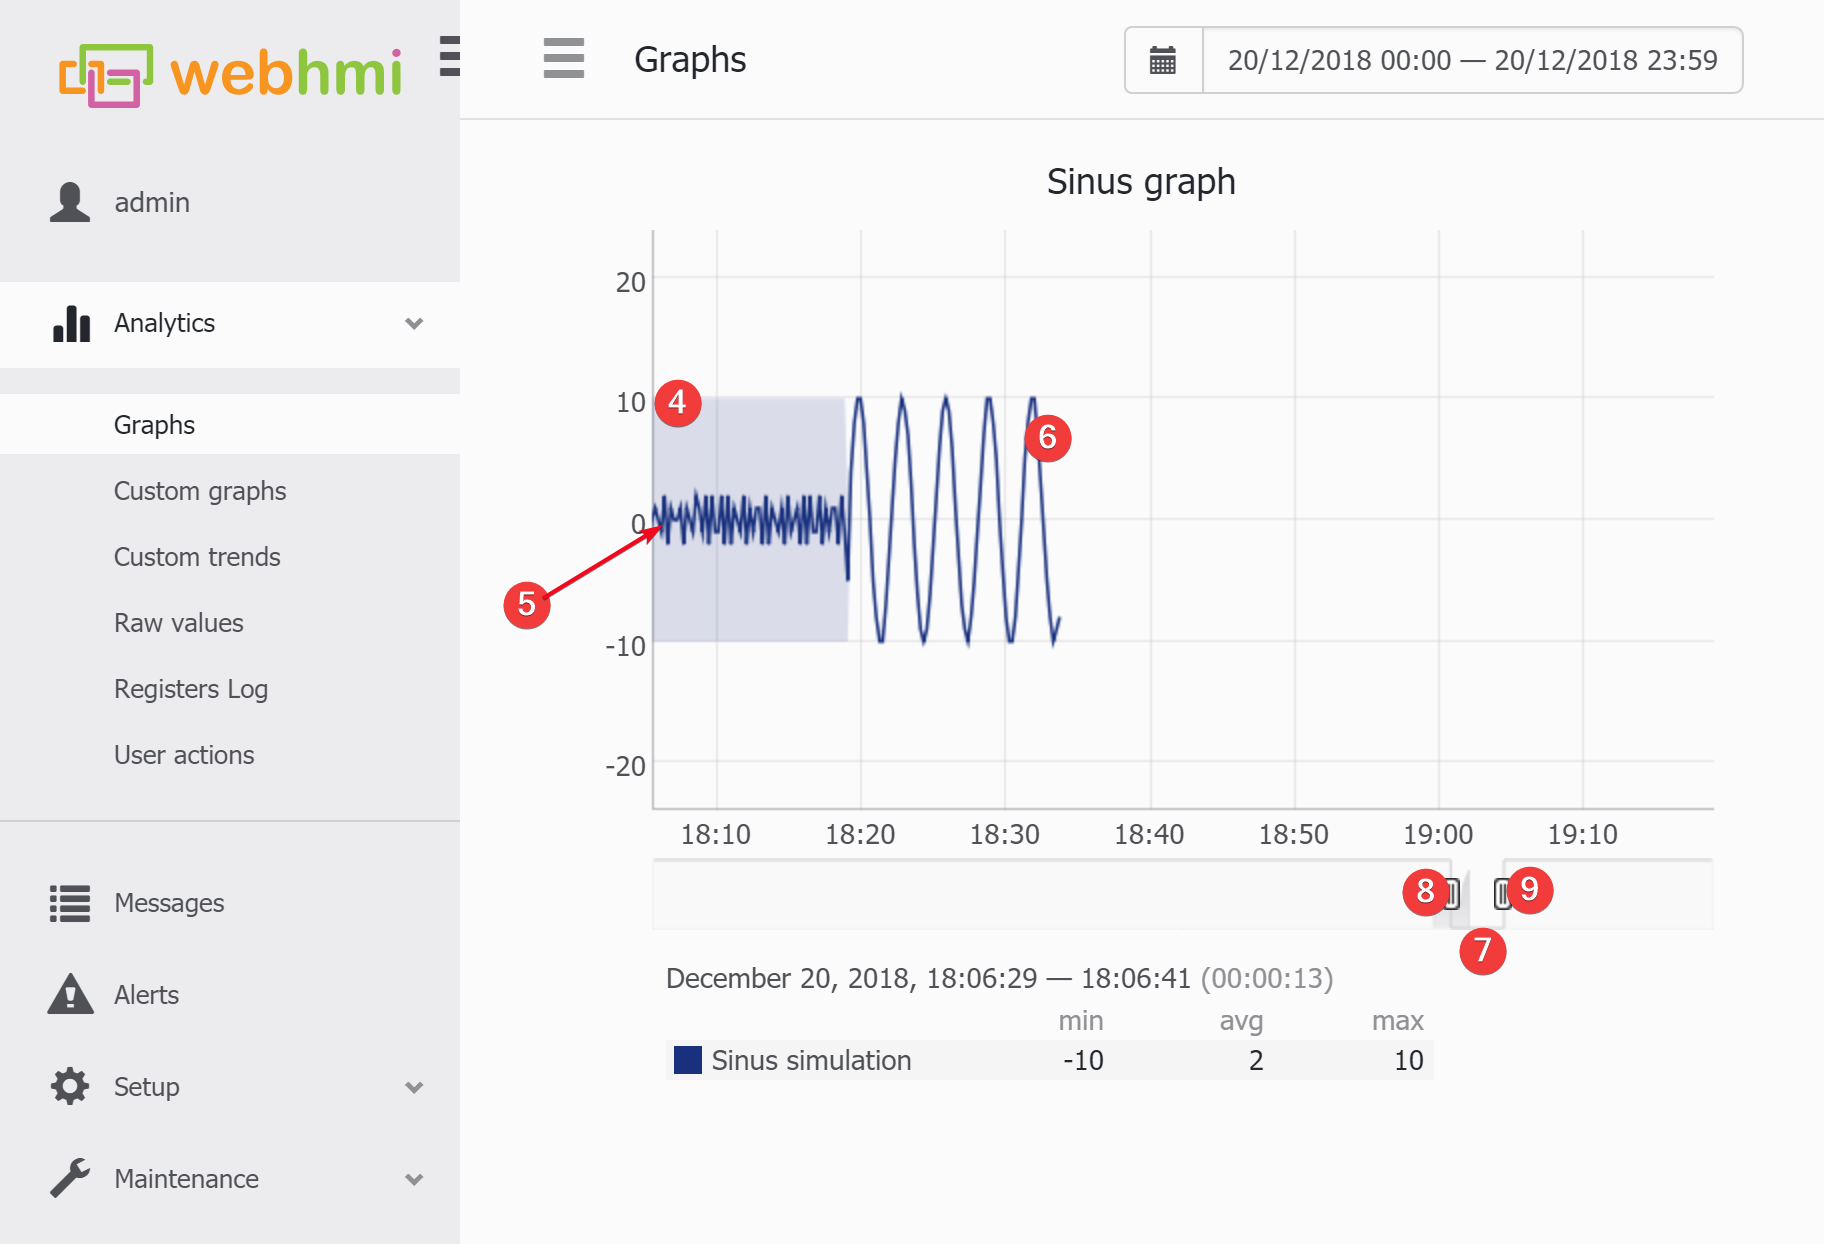
Elements of the graph:
- (1) - calendar for selecting date/period of view
- (2) - graph title
- (3) - title of a register ( or its legend in the graph settings) and respective values in the selected point on the curve. Because with large time scale there can be more log data in a given pixel of the curve (which corresponds to one X-axis tick representing time span / graph area in pixels ) 3 values are shown - minimal, average and maximal. When there are values in the log database for all points of curve in a given time scale, all three values will be the same ( and the curve will look “pure”). See more on this below.
- (4) - semitransparent color draws a swing between min and max values that the selected register took on a given plot section.
- (5) - line of averaged values.
- (6) - line of (almost) exact values.
- (7) - viewport slider. You can move the viewport slider along the time axis, thus choosing the interval of interest with the same time scale
- (8) - viewport slider changing size left handle
- (9) - viewport slider changing size right handle
See explanation below for the spots #4, #5, #6 .
Navigation in the graph viewing area
- double - click will zoom viewport to the time interval chosen in the calendar
- selecion with the mouse will change the viewport to the selection borders
- holding Shift allows to “drag” the viewport alongside X-axis with mouse movement
- or the same can be done “dragging” viewport slider
See the video:
Graph curve display features
Below is the video clearing how the curve's 4, 5, 6 parts are formed as well as min, max and avg values.
In this example, the register's property was set to use data from log and save on every change. The sinus value was calcualted in a script executed each scan. Then system scan time was changed from 50 ms to 1 seconds. Becuase graph viewing area resoluon is 1 seconds, more data saved in database log for any given point when scan was 50 ms and that was highlighted with semitransparent zone along the curve.

In the case when for a selected plot scale 1 minute or more will fit into 1 pixel of the screen, then the average values (5) of the register and the zone (4) of the range of values for estimating the distribution of the minimum and maximum peaks will be displayed on the graph. This averaging is drawn using cached data from the database, corresponding to the current scale of the view (in the database, averaging is stored for 1, 2, 5, 15 and 60 minutes). This method allows you to optimize the work with graphs when viewing large amounts of data on a different scale, while maintaining the speed of work.
When the current view time scale matches log speed of the parameter, the (6) solid lined is drawn so that there is either exact value, or its average / min / max are very close to each other.