Using events, lua, screens and JS for complex reports
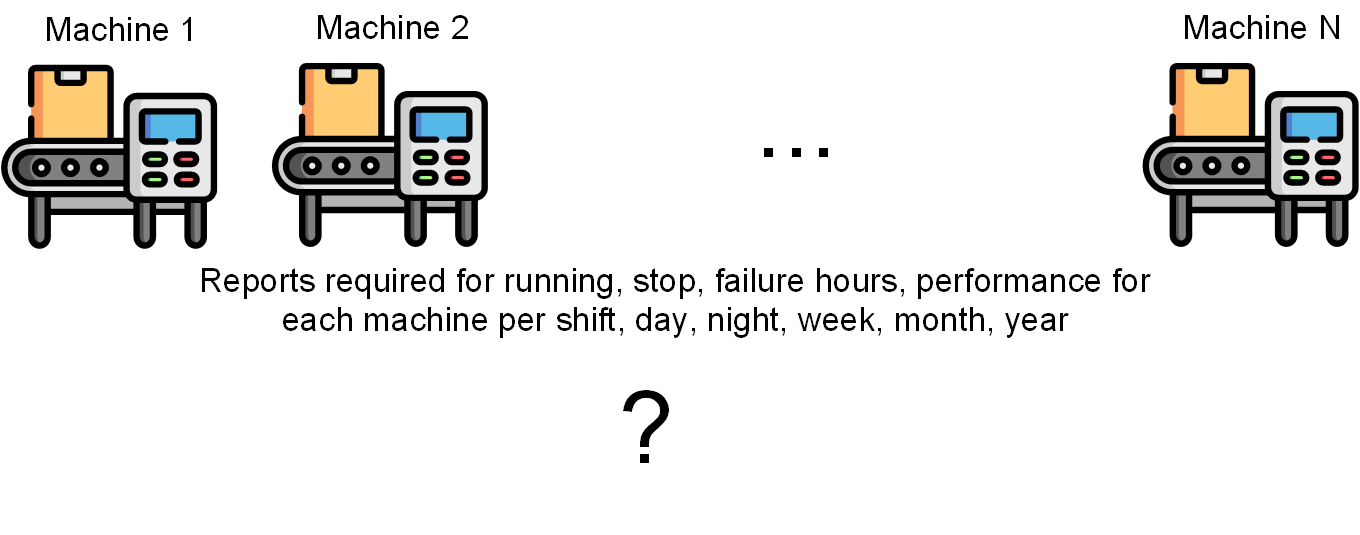
In this application, the customer had production line with multiple machine installed. There were PLCs in each machine which counted run, stop, failure hours and performance counter.
The task was to create a report in WebHMI for each machine with these figures for the given period.
There is an event report builder, but it in this application it would had the following drawbacks:
- N reports would have to be configured.
- For each N several events would have to set up - for day, night, shifts, weeks etc reports
- There reports would likely be occasionally broken at the times when admin changes something in the project.
Because all data were logged and existed in the DB, a self-evident appeal arised for the solution or tool, which just would made a request for the required data in the DB and showed them.
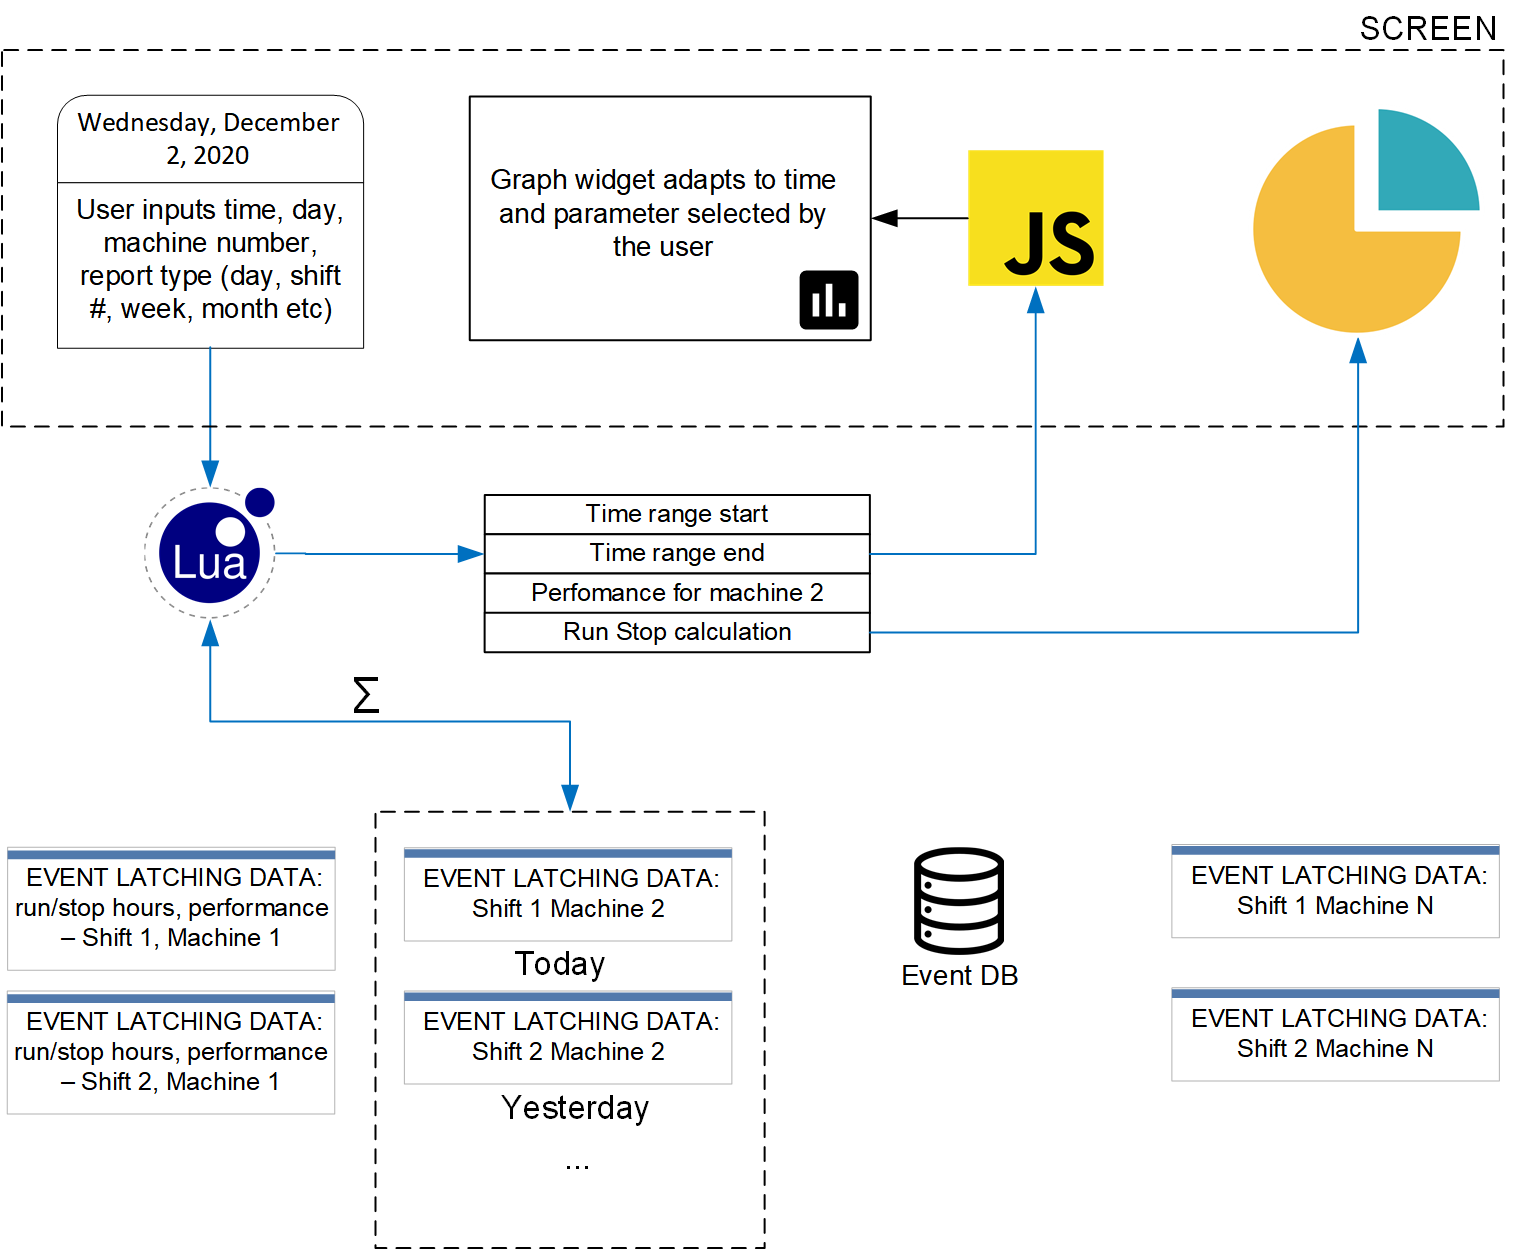
After considering possible solution, the following WebHMI's functionanlity helped to create a single elegant tool:
- Screen with dashboard where user chooses time period for the machine and the machine number
- Screen widgets: register value to show perfomance data and pie chart to show percentage of run/stop hours
- Lua script which makes API request to WebHMI itself for the run, stop, performace counter values and calculates the differences
- Graph to show how the machine performed during this time
- JS to modifiy graph properties (parameter to show and time axis settings)