Table of Contents
![]()
Curves
Introduction
 Curve is a way to define output value from a pre-defined pair table of a discrete set of known data points. Such as standard or desired value.
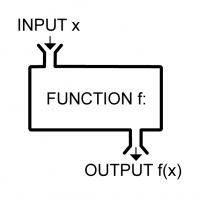
Curve can be represented as a function f, which is a blackbox, where is some INPUT x have corresponding OUTPUT y = f(x)
Curve is using a piecewise linear interpolation, is a curve fitting which is a allow to using linear polynomials to construct new data points within the range of a discrete set of known data points.
Curves can :
- be edited at any time.
- have a static register for storing it.
- be read from string register.
- be copied to another string register using dashboard element.
To create a curve you need to define Y and X value for known points using visual editor or digital input form.
There are several options for using curve:
- The dependence of Y on X (function) is given by the table of pairs.
- The function should be empirical defined.
- There is strict algebraic function and value should be calculated.
- The function should be sequentually or time-to-time changed.
To define curve algebraically, it is linear interpolation between two known points for every piece used. Its string reprentation is a JSON formatted linear polynomial factor “k”, syllable “b” and function definition domain “range” values for every piece of a curve, so that inside the range of INPUT x value OUTPUT y value can be calculated as
y = k⋅x + b
For example:
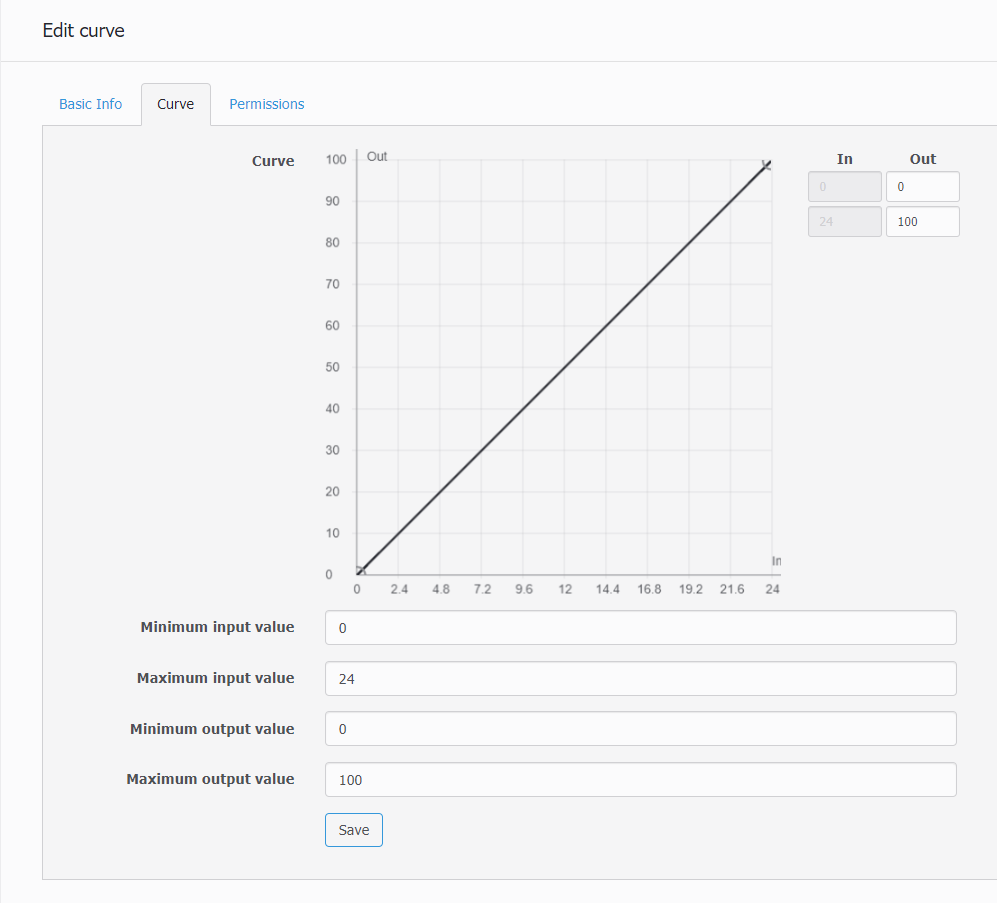
At minimum it can be two points.
Binary logic function.
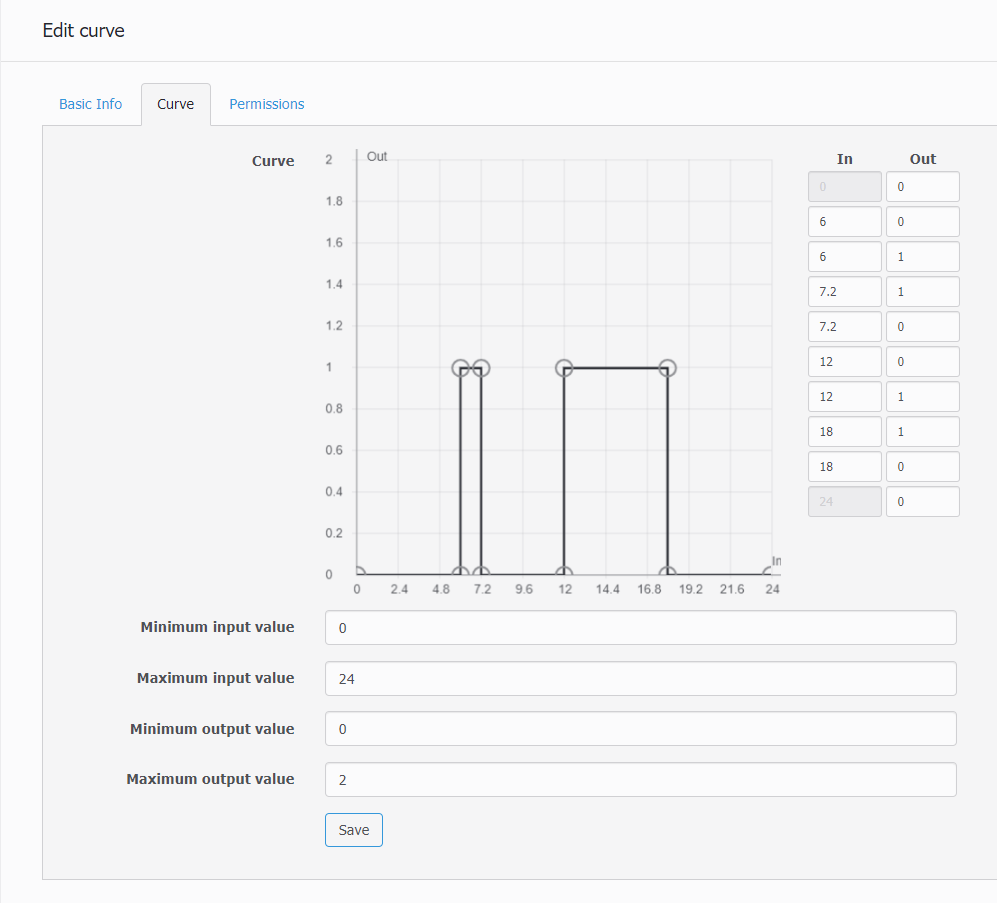
Table parameter definition
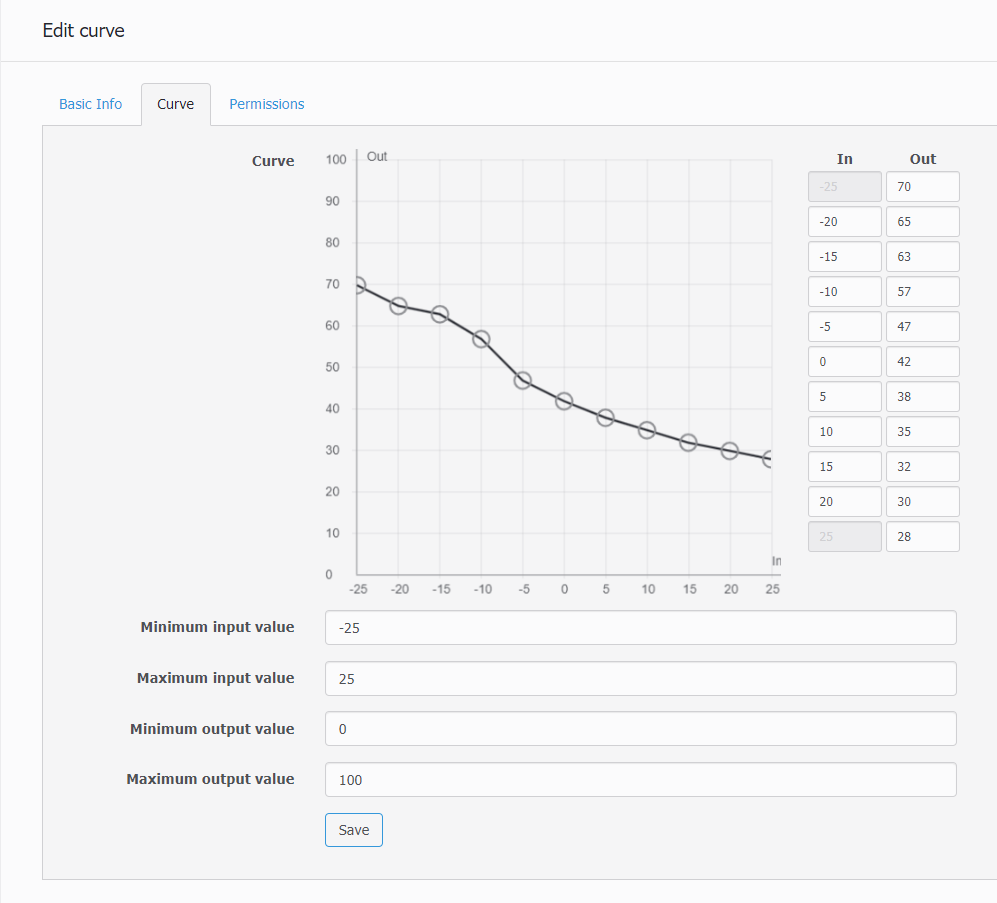
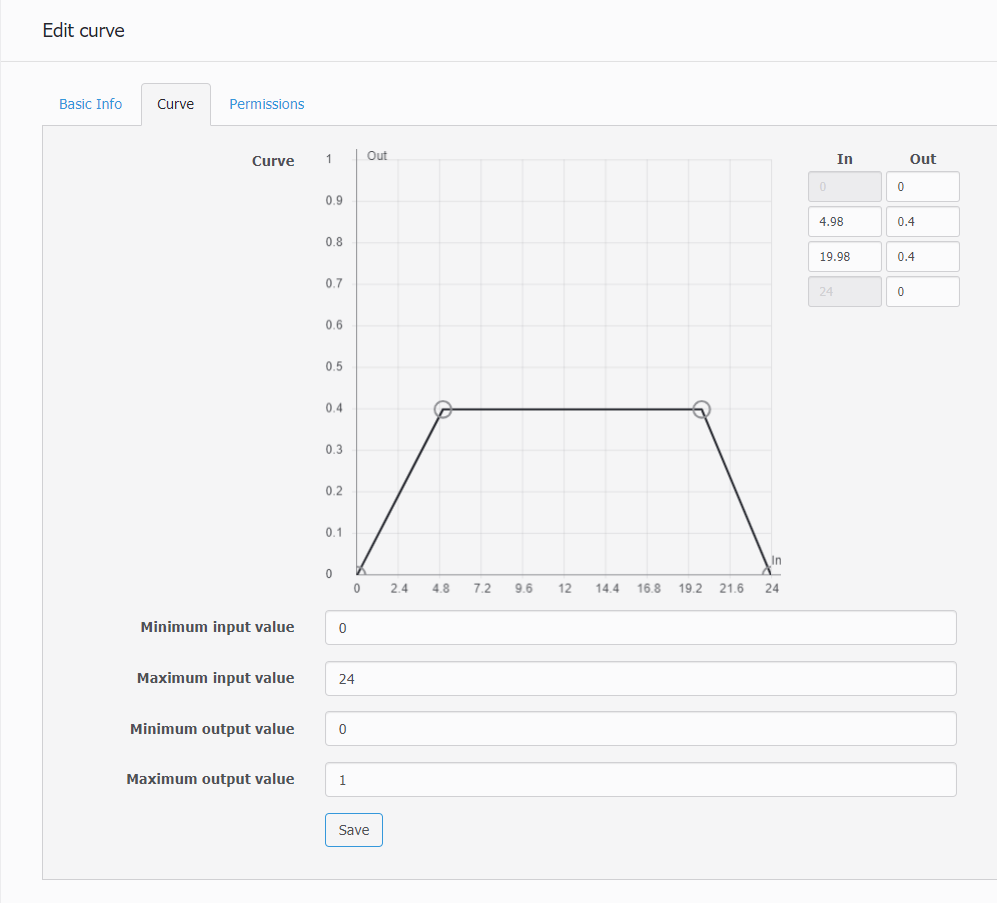
Saturation function
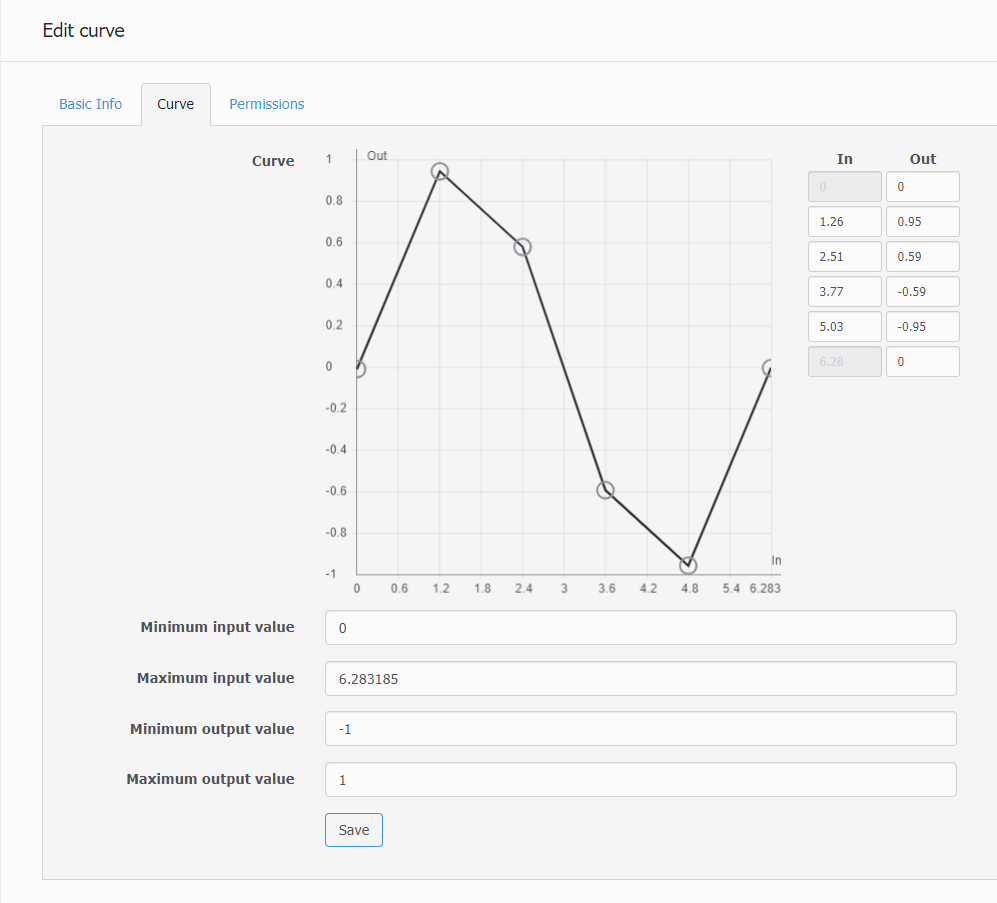
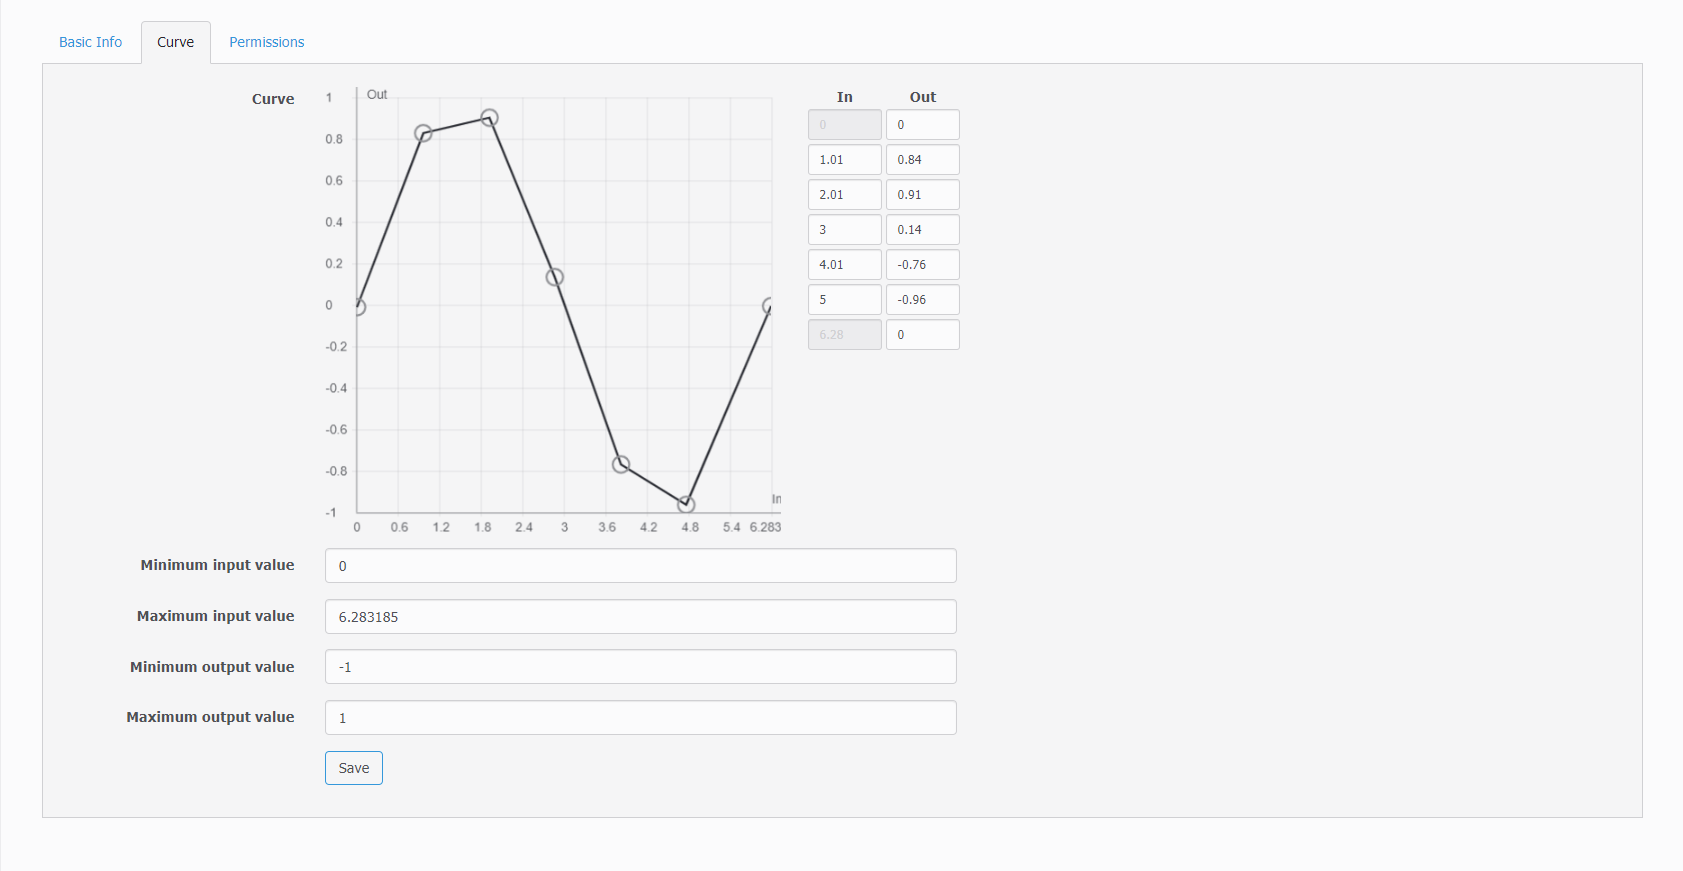
Algebraic defined calculated function. For example sin(x) with 6 points approximation.
New curve creation
Let's create a new curve.
Click on “New curve” button.
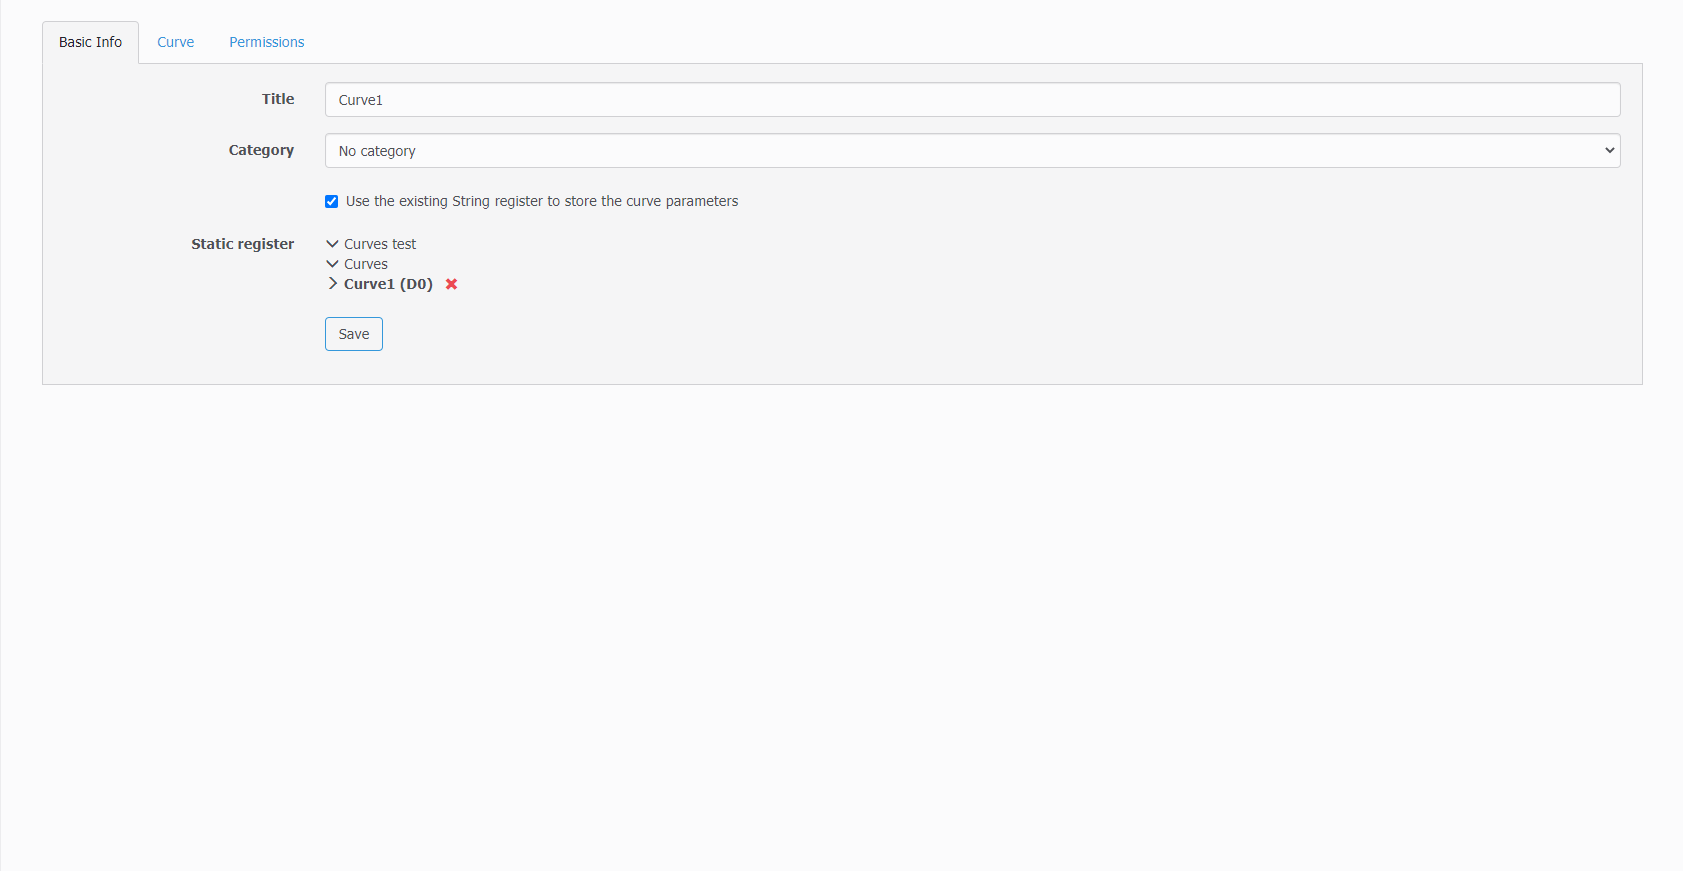
Type in a Title and go on the next tab Curve
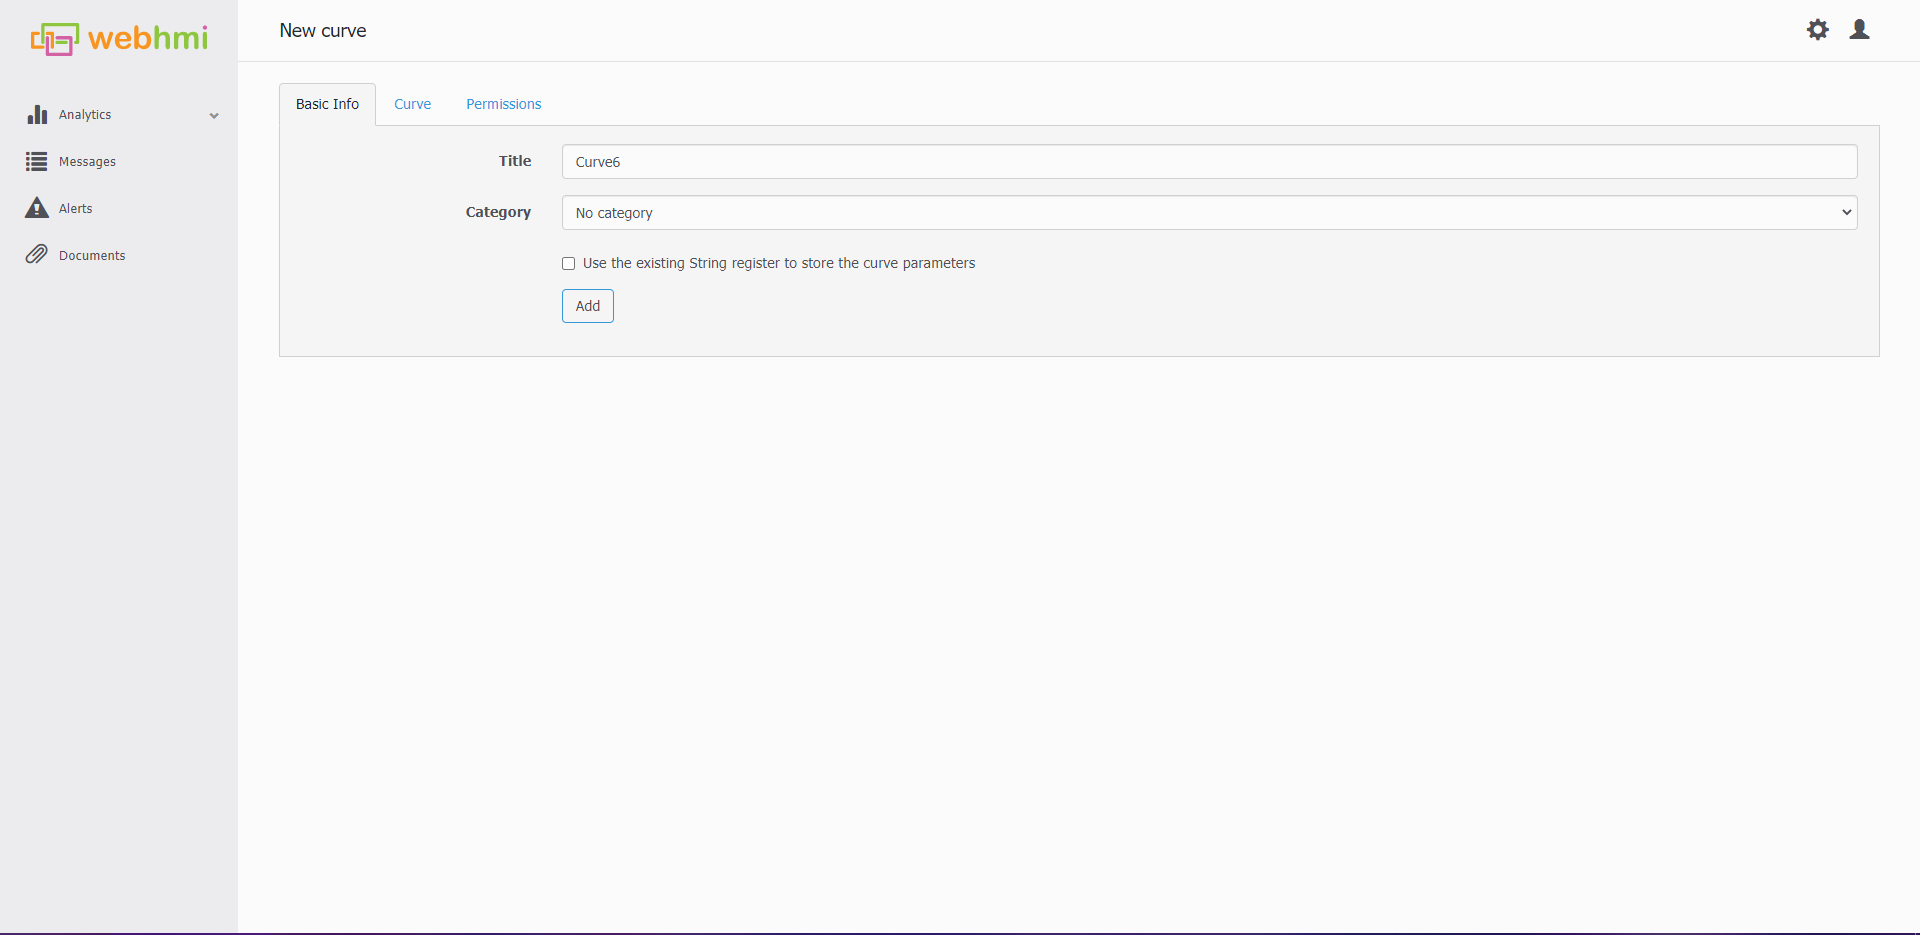
Optionally, you can check “Use the existing String register to store the curve parameters” to store it all the time in this register if you will.
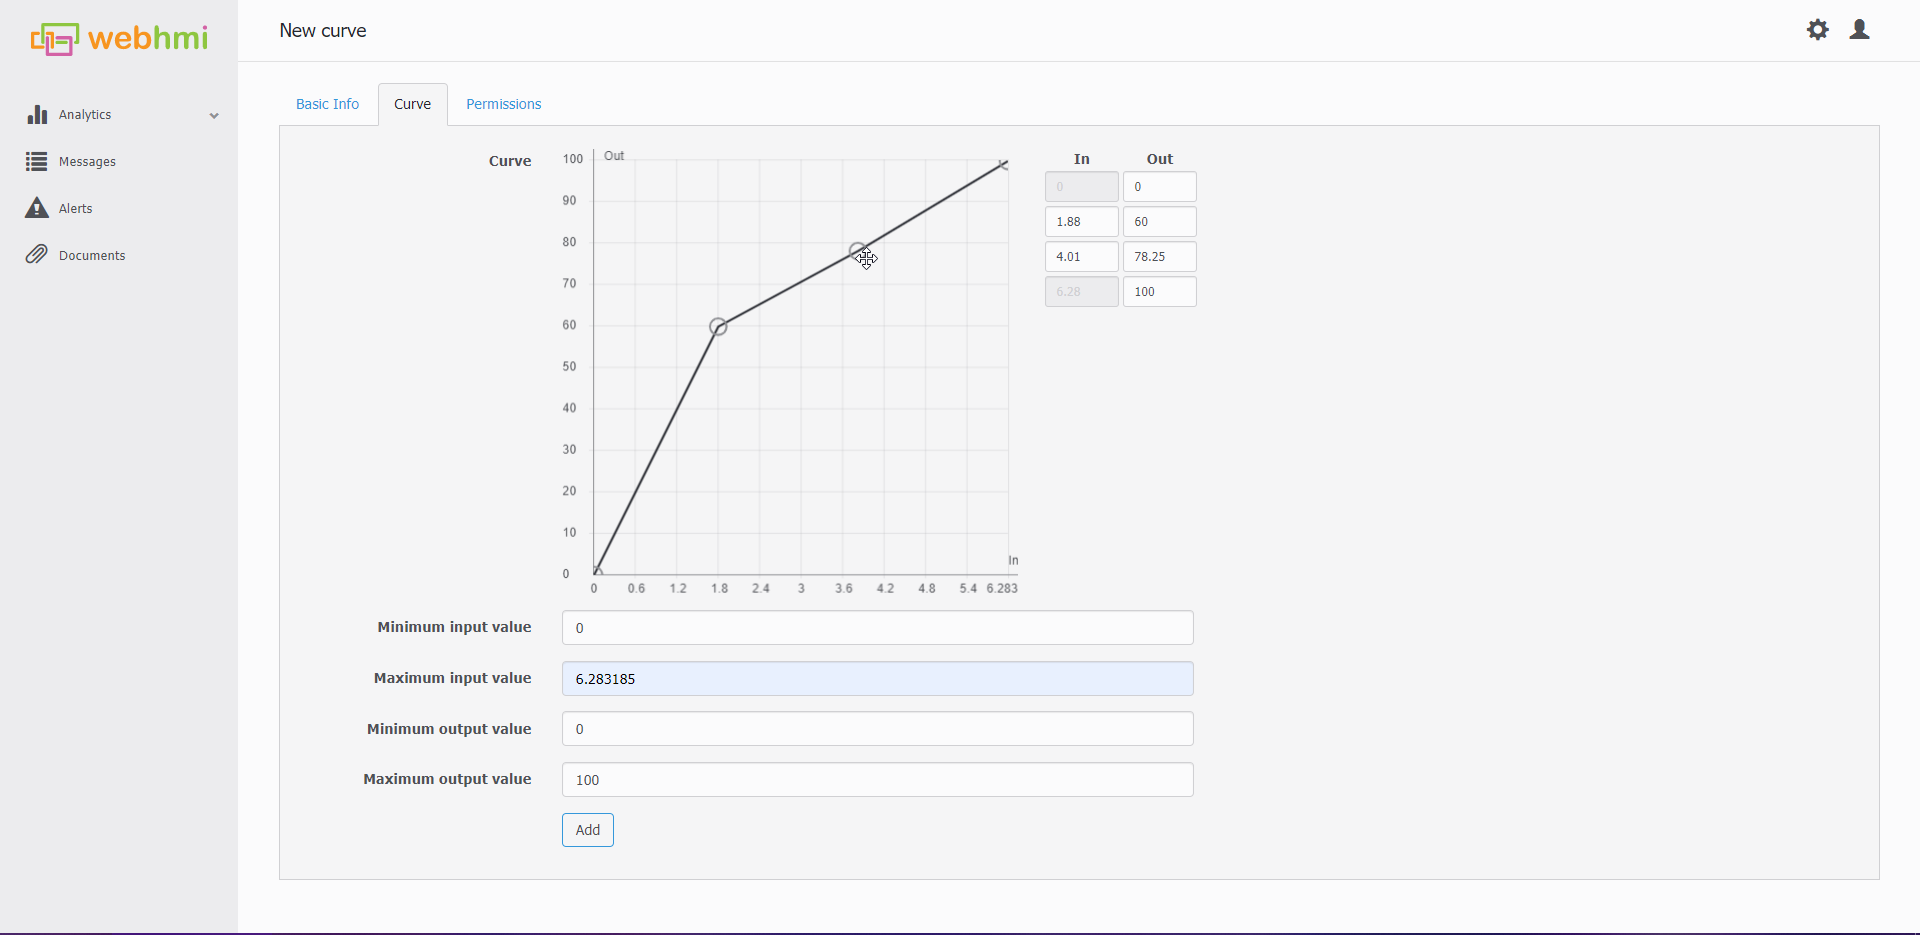
Here is a curve editor. There is a domain of a function definition, range of a function and every point X and Y coordinates.
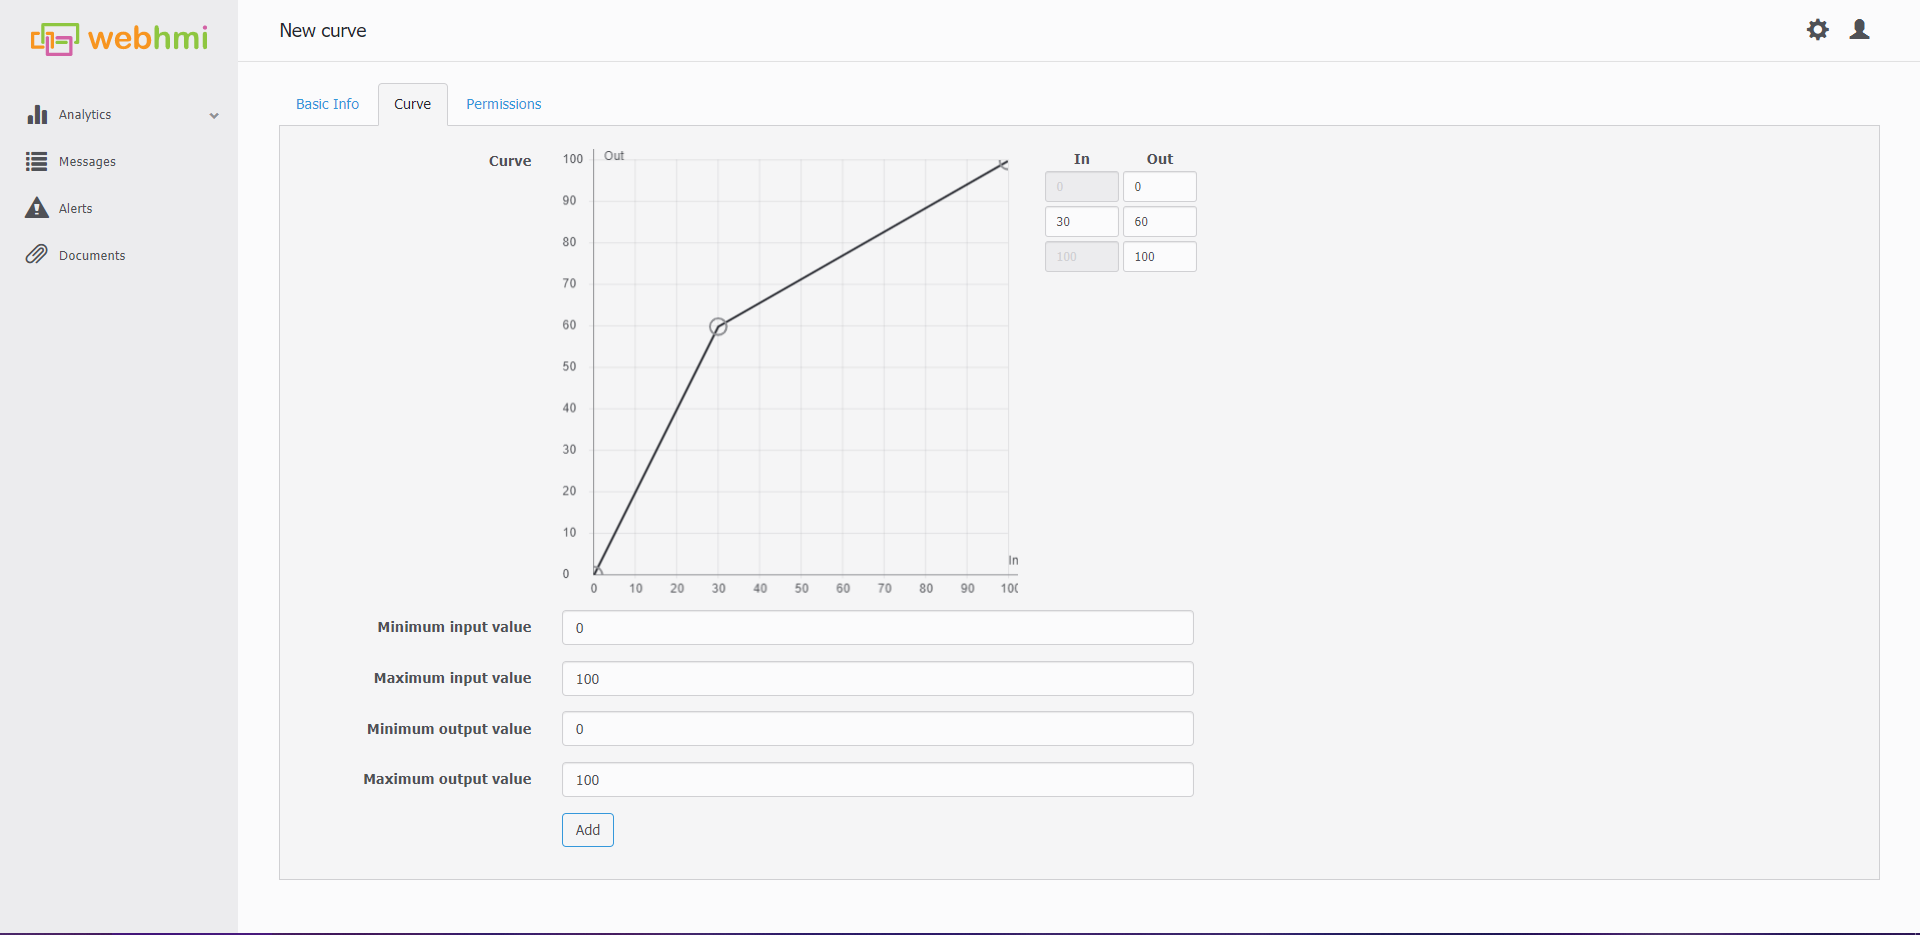
To create a new point click twice on a line. To remove it click with holding Alt button.

Then you can both move point or specify its value using form in the right.
At the end, when all the rest of parameters set let's look at the result . In our example it would more precise approximation of sin(x) with 7 point defined
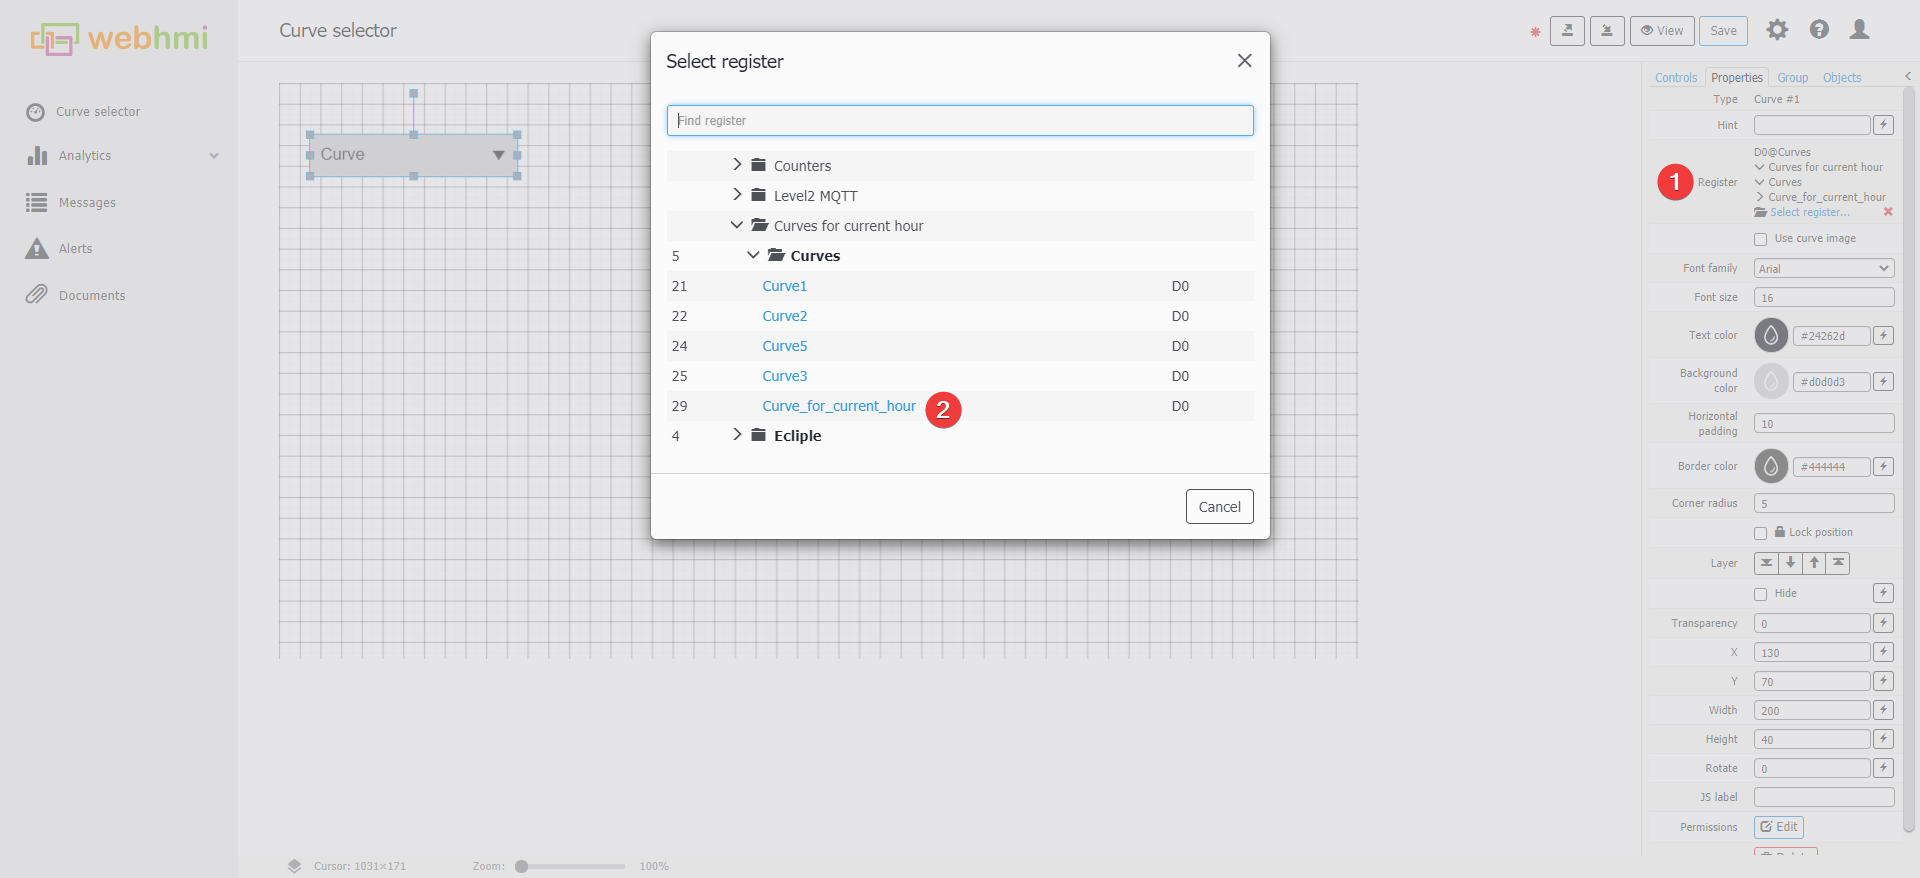
Select a curve to put in register
To get the value you need:
- Have a curve
- Have a string register for dashboard element to put selected curve in it
- Optionally, have yet another string register for store that curve all the time
Now, it is time to create a register with value type “String” for dashboard element.
Then, create a new dashboard.
 Click the “Add dashboard”.
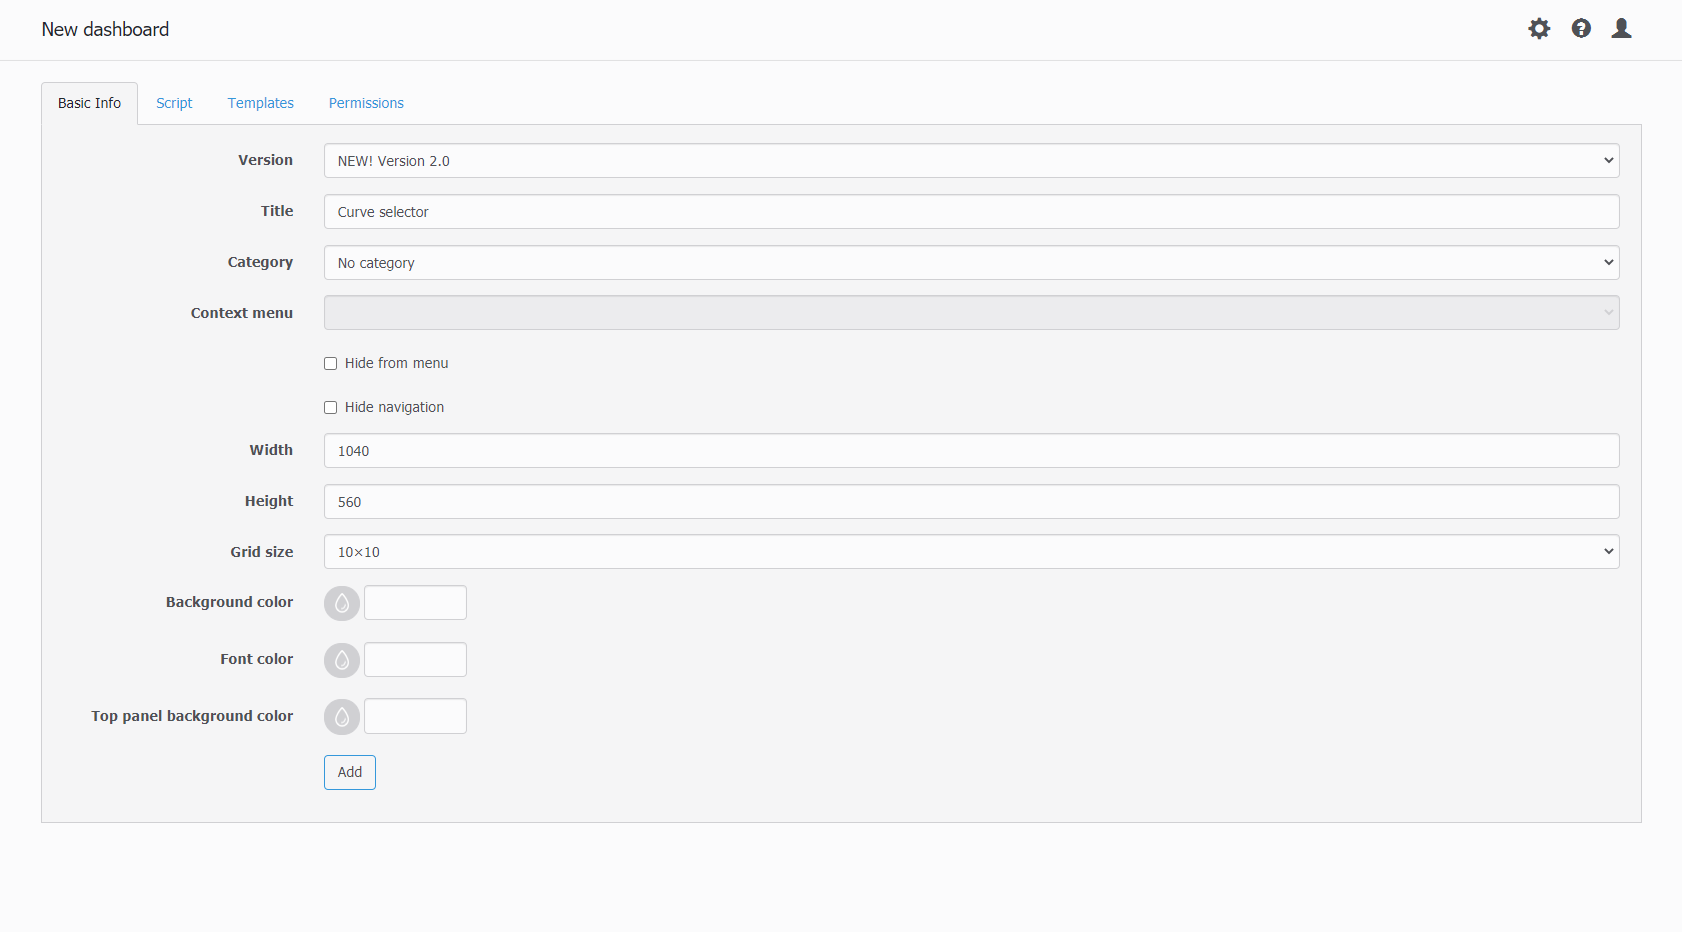 Type in the Title and go on.
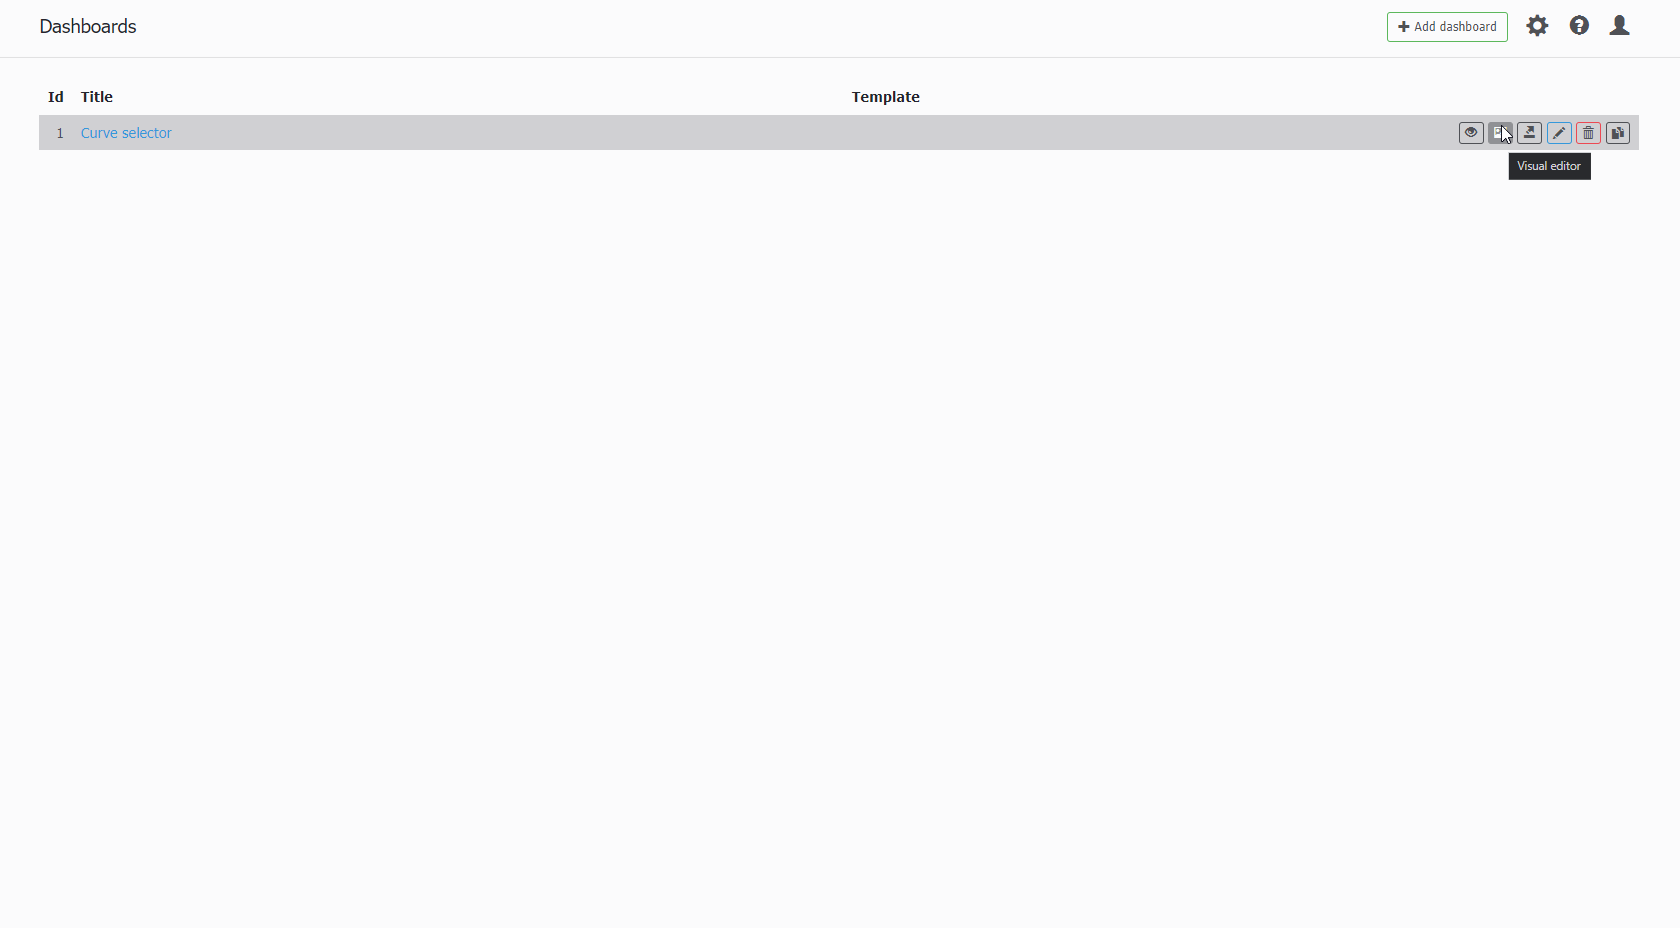 Go to a visual editor.
To do this, there is a dashboard element “Curve”.
 Drag'n'drop it to create a new one.
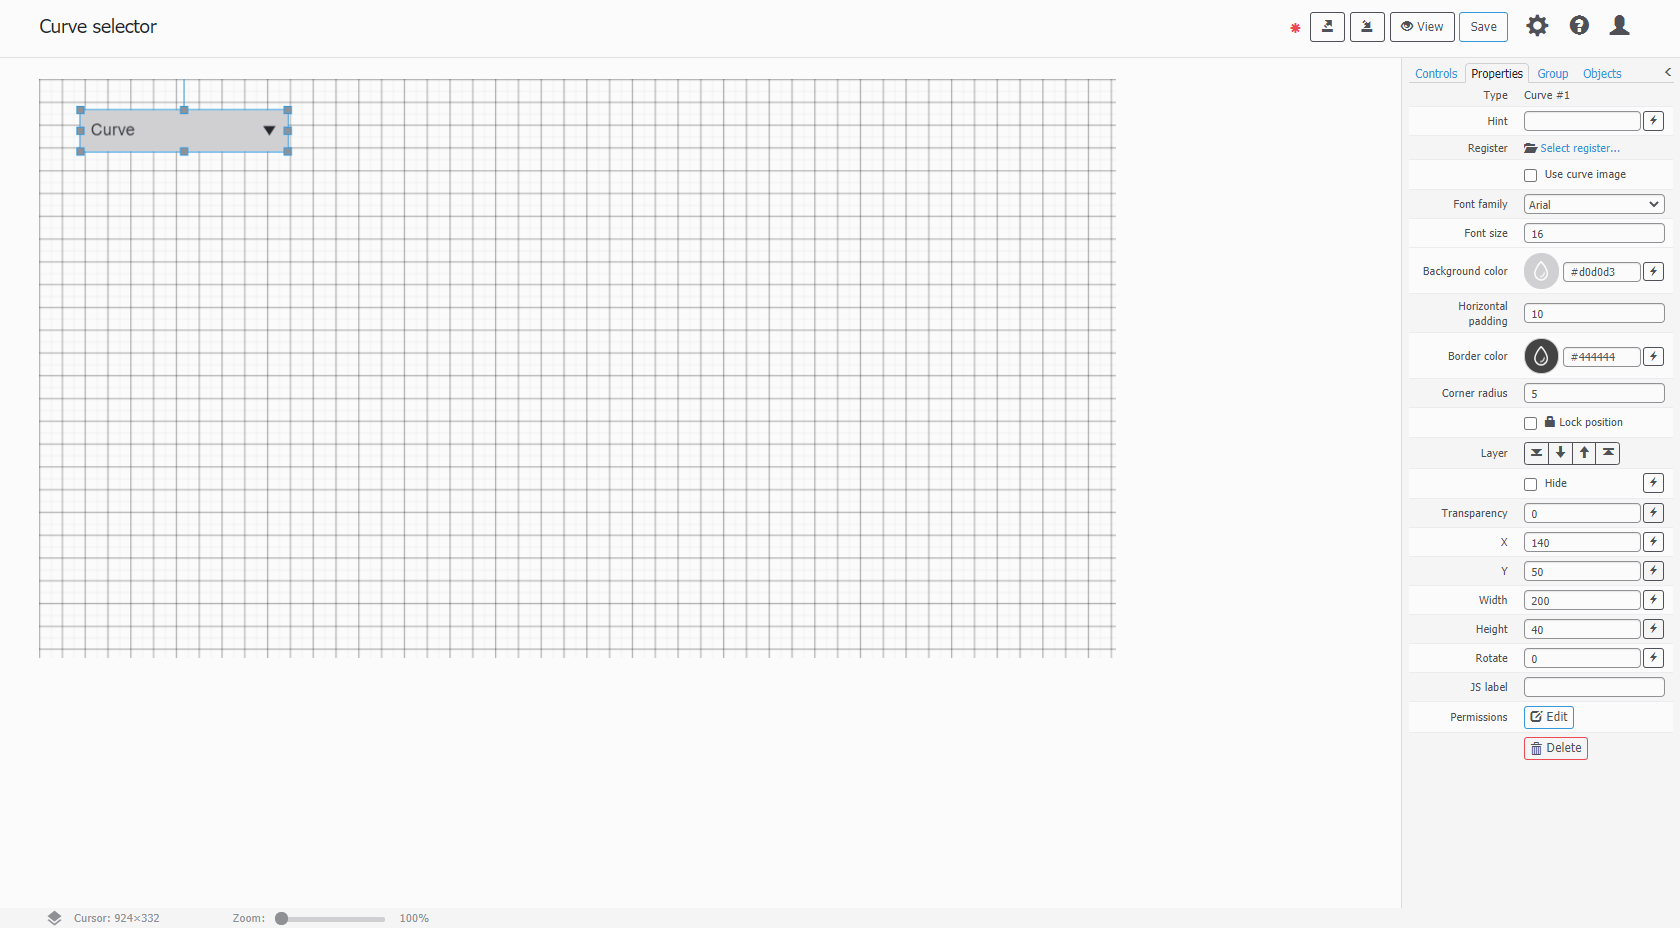
Pick a register to be used later in Lua script to get value.
 Let's test it.
Now, you need to put the curve to string register via dashboard.
Let's test it.
Now, you need to put the curve to string register via dashboard.
 Click and select the one you want to pick. There is a icon for open curve editor.
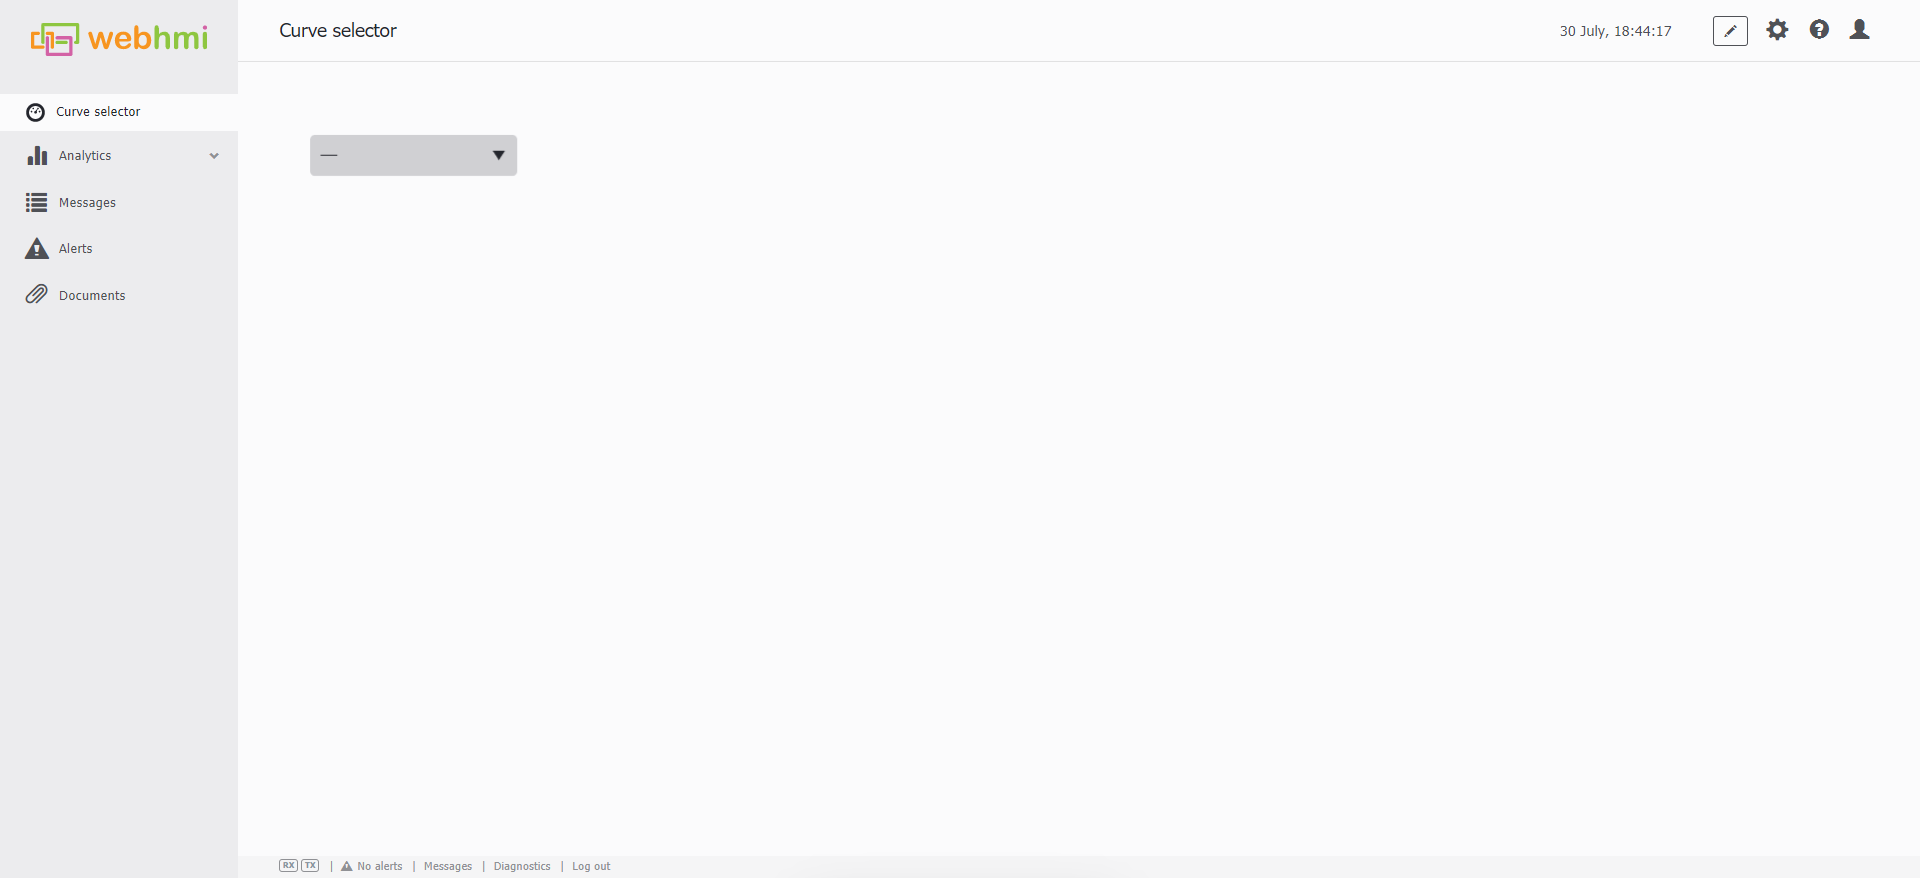
 There is a picked one.
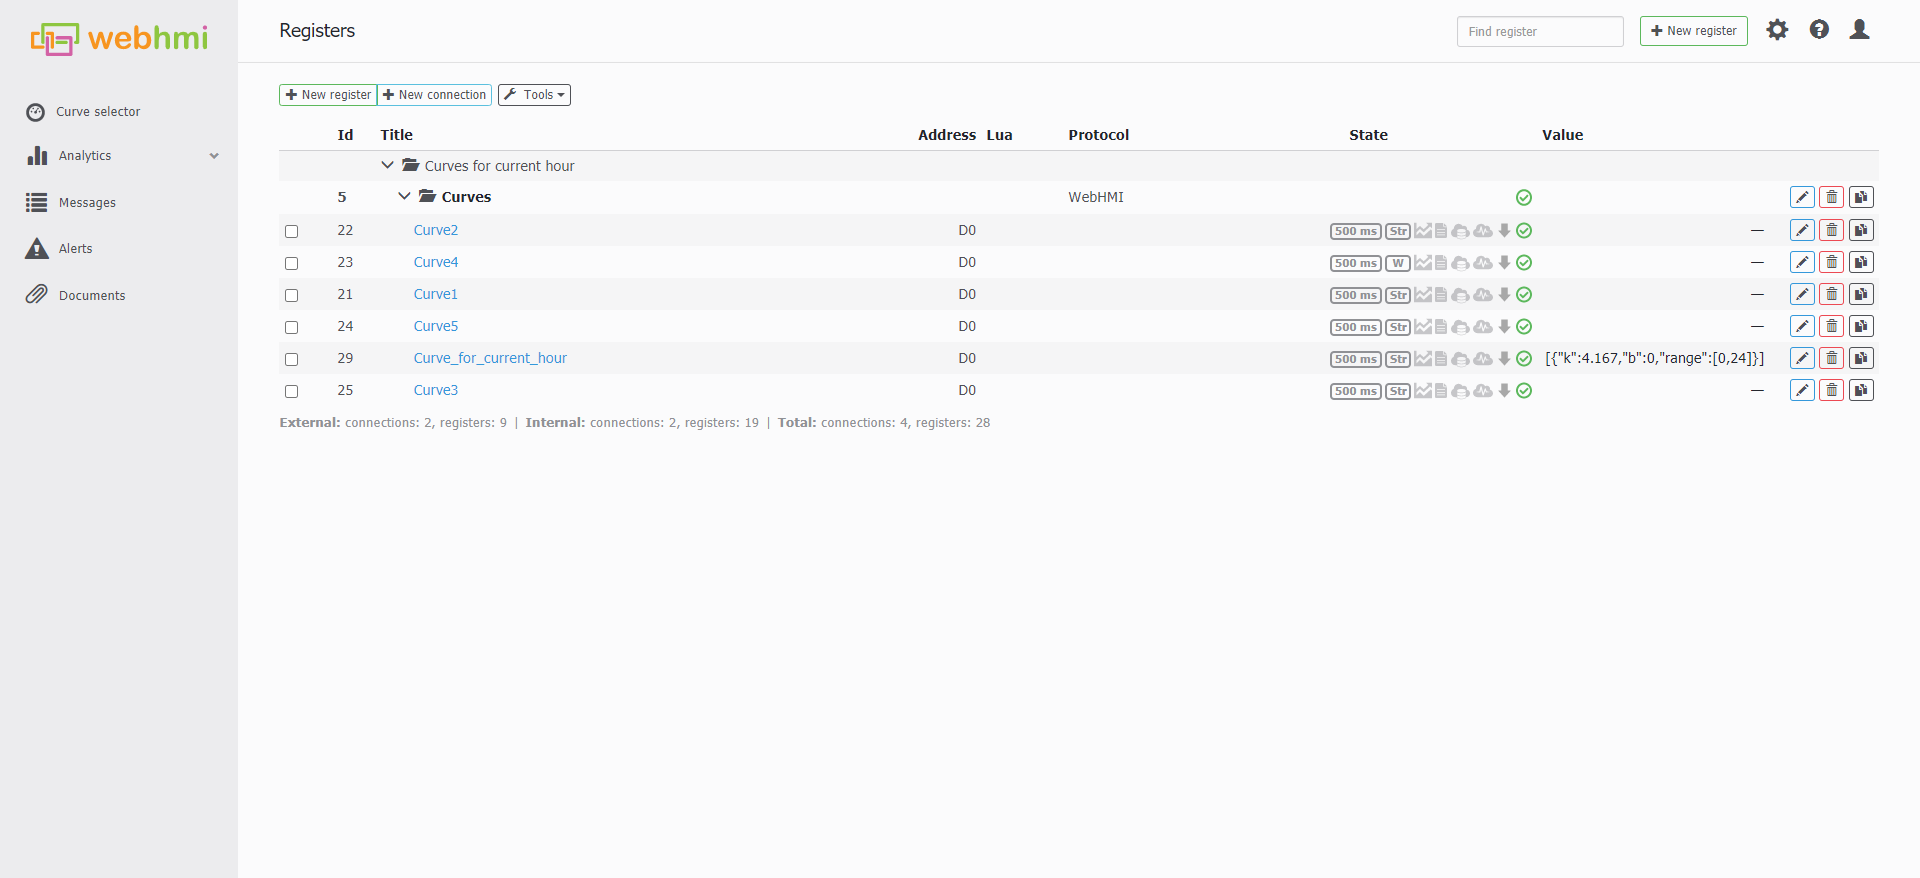
 Let's check the register.
Get value from the curve via Lua
To get the OUTPUT y value from existing(pre-created) curve, you need:
- a Lua script to work with string register and
- include a Lua lib, which will provide access to that function.
- create a register for dashboard element.
- create a dashboard, with “curve” element, where you can select which curve will be stored in the bound register.
- Call a GetCurveValue function and pass to it this
registerand INPUTx.
- - curves.lib
--[[
The function does curve conversion f(inputValue) = outputValue
Example of a curve, having multiple ranges of kx + b, set in a register of a String type with Json
[{"k":4.167,"b":0,"range":[0,3]},{"k":0,"b":12.5,"range":[3,27]},{"k":-4.167,"b":125,"range":[27,30]}]
--]]
function getCurveValue (curveReg, inputValue)

    local s, e = 1, 2                           -- start & end indexes of the subranges
    local tab = cjson.decode( R(curveReg) )
    local outputValue, stickOutflag

    for _, sub_ in ipairs(tab) do
        if ( (sub_.range[s] <= inputValue) and (inputValue < sub_.range[e]) ) then
            return (inputValue * sub_.k + sub_.b), nil                             -- normal sequence
        end
    end
    -- edge cases
    if  (inputValue < tab[s].range[s]) then
        outputValue = tab[s].range[s] * tab[s].k + tab[s].b
        stickOutflag = 1
    elseif (inputValue > tab[#tab].range[e]) then
        outputValue = tab[#tab].range[e] * tab[#tab].k + tab[#tab].b
        stickOutflag = #tab
    end
    return outputValue, stickOutflag
end
Example of usage:
- - Getter
include "curves.lib"

function main (userId)
    local SAFE_VALUE = 10
    local curHour = tonumber( os.date("*t", os.time()).hour )
    INFO("curHour "  .. curHour)
    local y, valueOutOfRange = getCurveValue("curve_for_curHour", curHour)

    if (not valueOutOfRange) then
        W("value_for_curHour", y)  -- WriteReg
    else
        W("value_for_curHour", SAFE_VALUE)
    end
end
Of course, you can fork a your own lib or use the given one.