Table of Contents
![]()
Custom graphs and trends (Analyitcs)
Custom trends and graphs do not need to be created and configured in the Setup menu section. Their main purpose is to quickly analyze the processes, changing the set of parameters, shifting and scaling them for easy viewing.
Custom Graphs
They are accessed in Setup / Analyitcs menu.
 This sub-menu will only be available if there is at least one register in the project with 'save data for graph'
 option set.
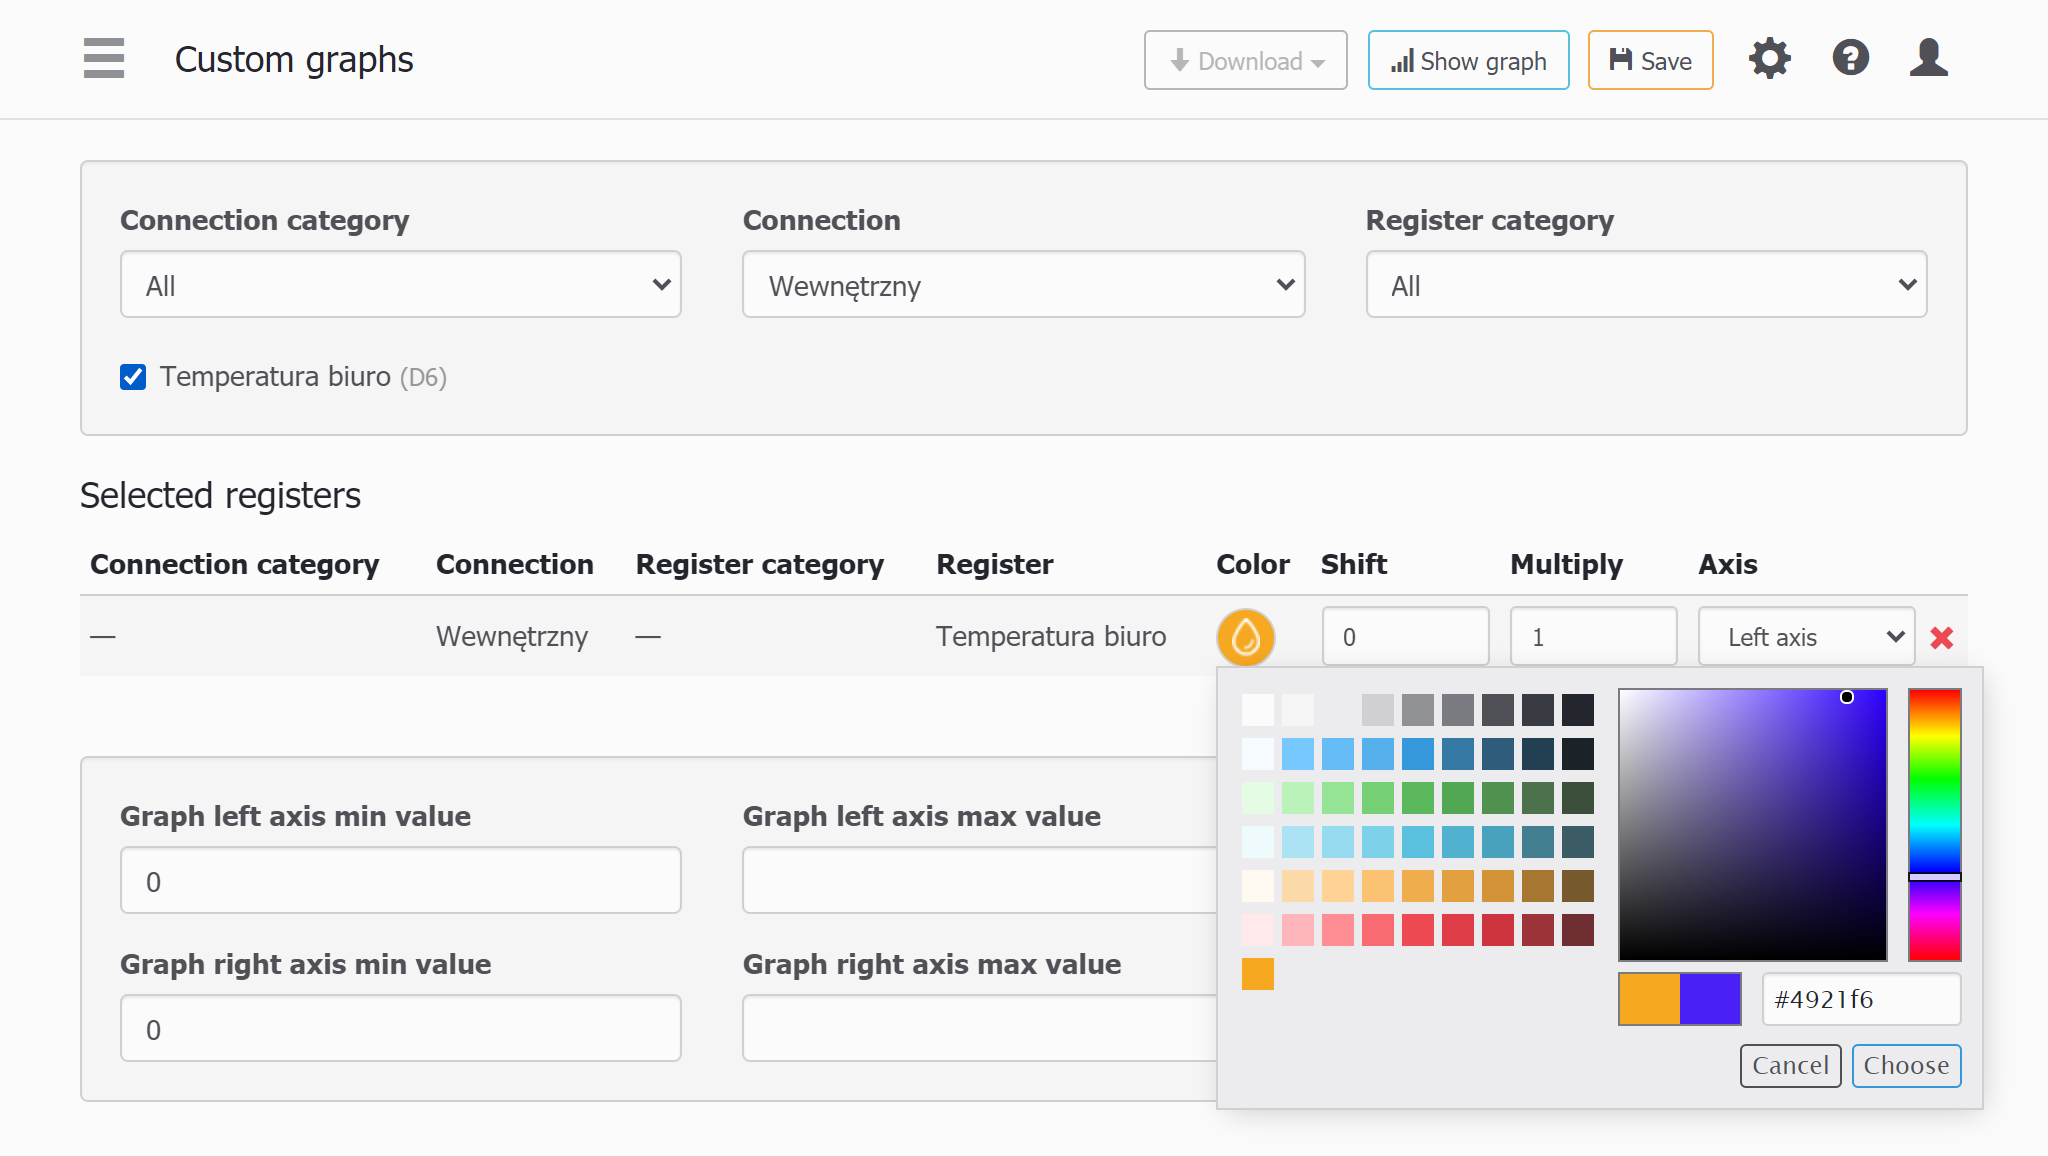
Then you can select any register from the project which have been enabled for logging, and set shift, multiplier and the vertical axis for the register's value.

Tip: The vertical scaling by default is set to 0..maximal value on the selected time interval. If the value
becomes  negative in some point the curve will be shrinked to 0 in this point. Don't forget to appropriately set
min.  marging for the vertical axis.

The navigation in the viewing area is the same as for graphs.
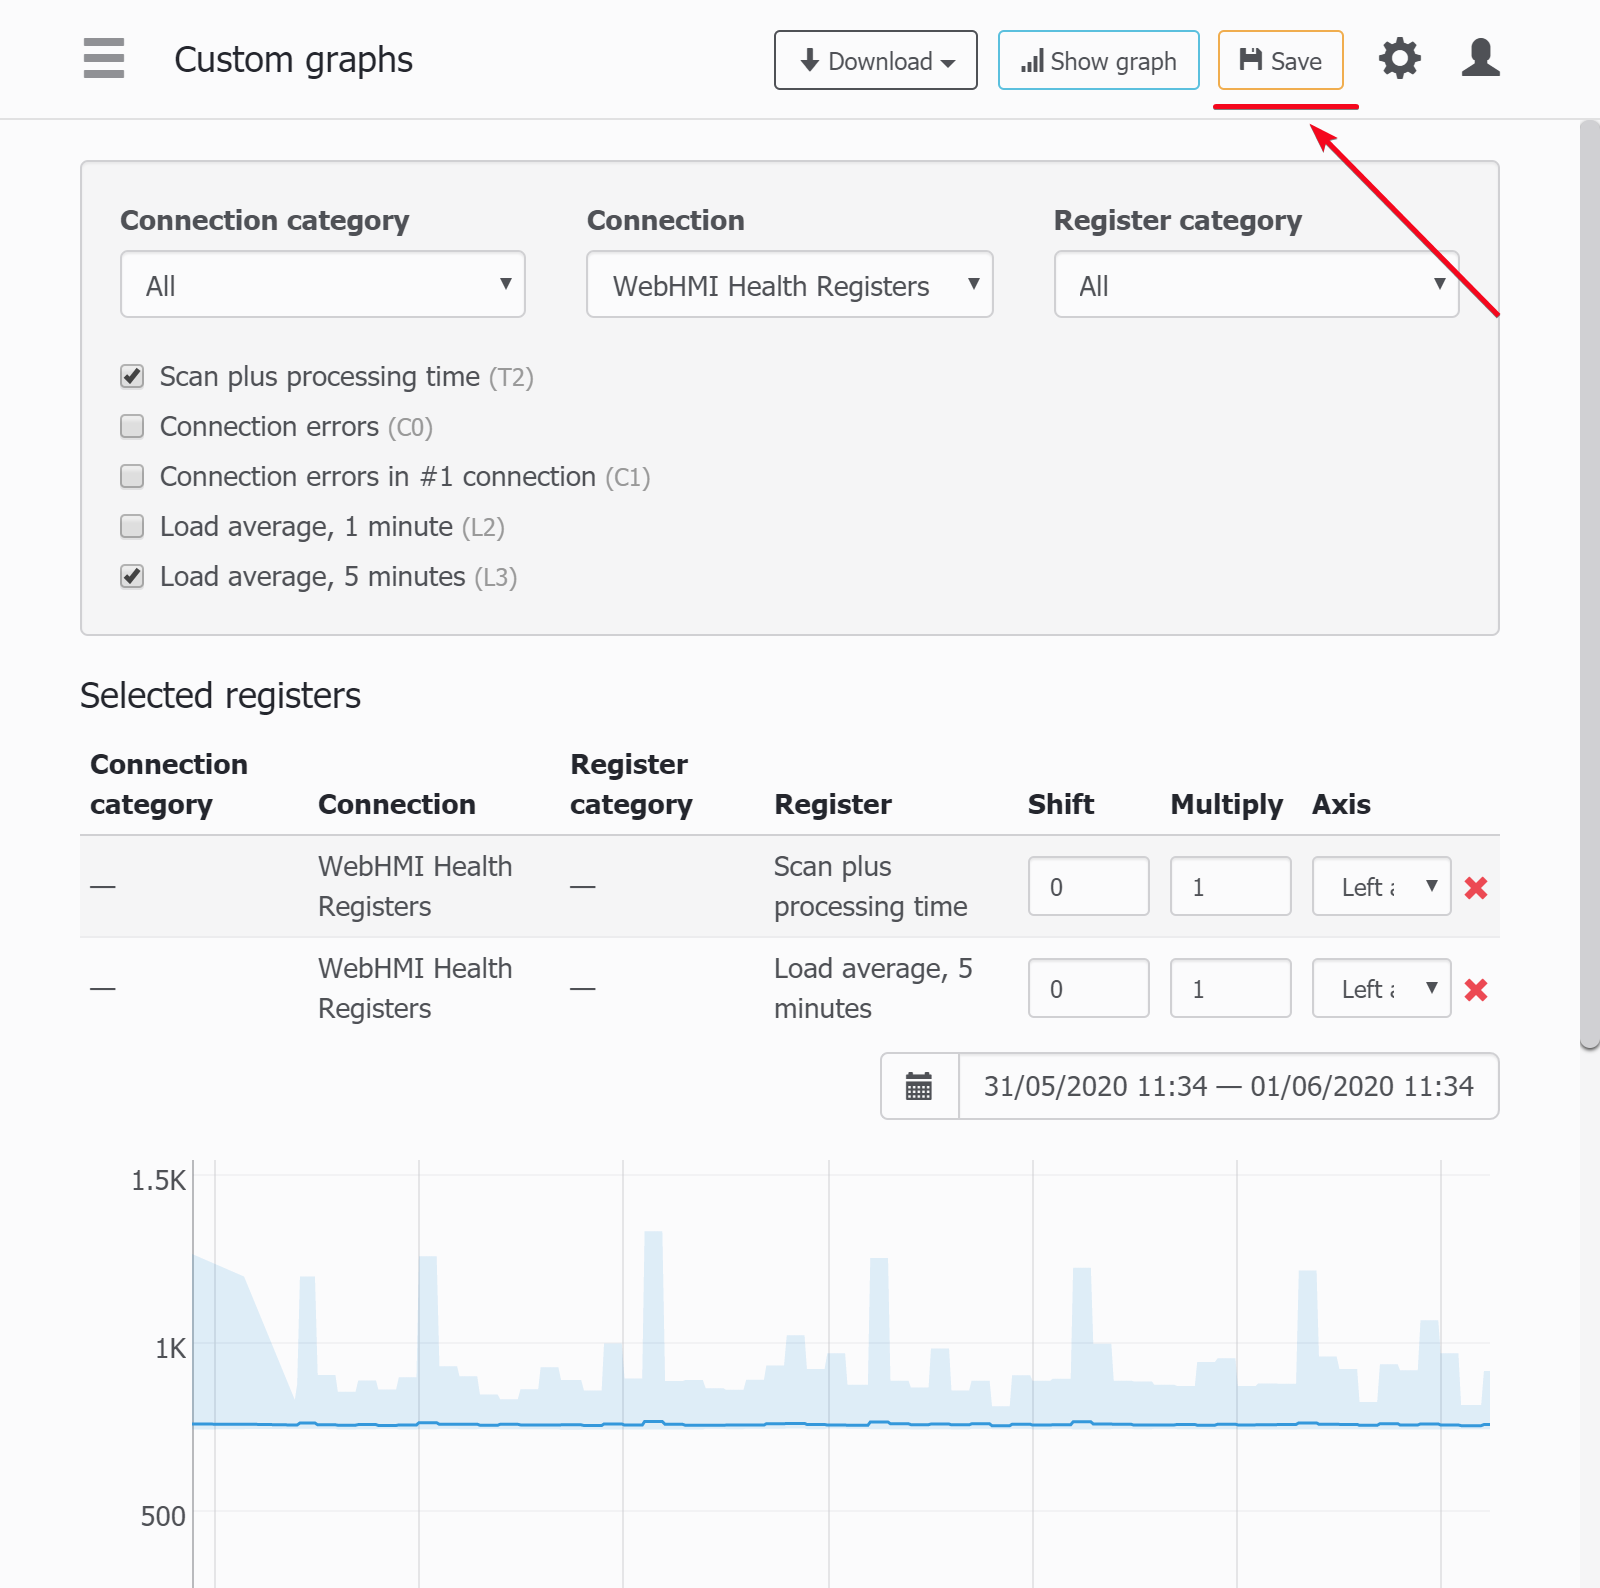
Saving custom graph as a static graph
After you configured some set of data on the custom graph, you can save it as a static(pre-defined) graph. This feature is available since the 4.0.7161 fw number.
You will be redirected to the page for creation a new static graph with register list from the source custom graph.
Custom trends
The custom trends entry is the next to custom graphs in the Analytics menu and it is always available becuase any register can be immediately viewed on the trend in real-time mode. The custom trend setup is the same as for graphs with the only difference they have extra setting for the time interval viewport will be scaled to.

Saving custom trend as a static trend
Starting from the 4.0.7161 fw number the custom trend can be saved as a static one, with the help of 'save' button. See the figure for the custom graph setup above.
Custom Gantt diagrams
Some data, like process or machine states (stopped, run, alert) with their duration can be conviniently presented on the Gantt diagrams, which are also available in Analytics menu (since fw 4.0.7161). The registers for the Gantt must have 'save to graph' property set.
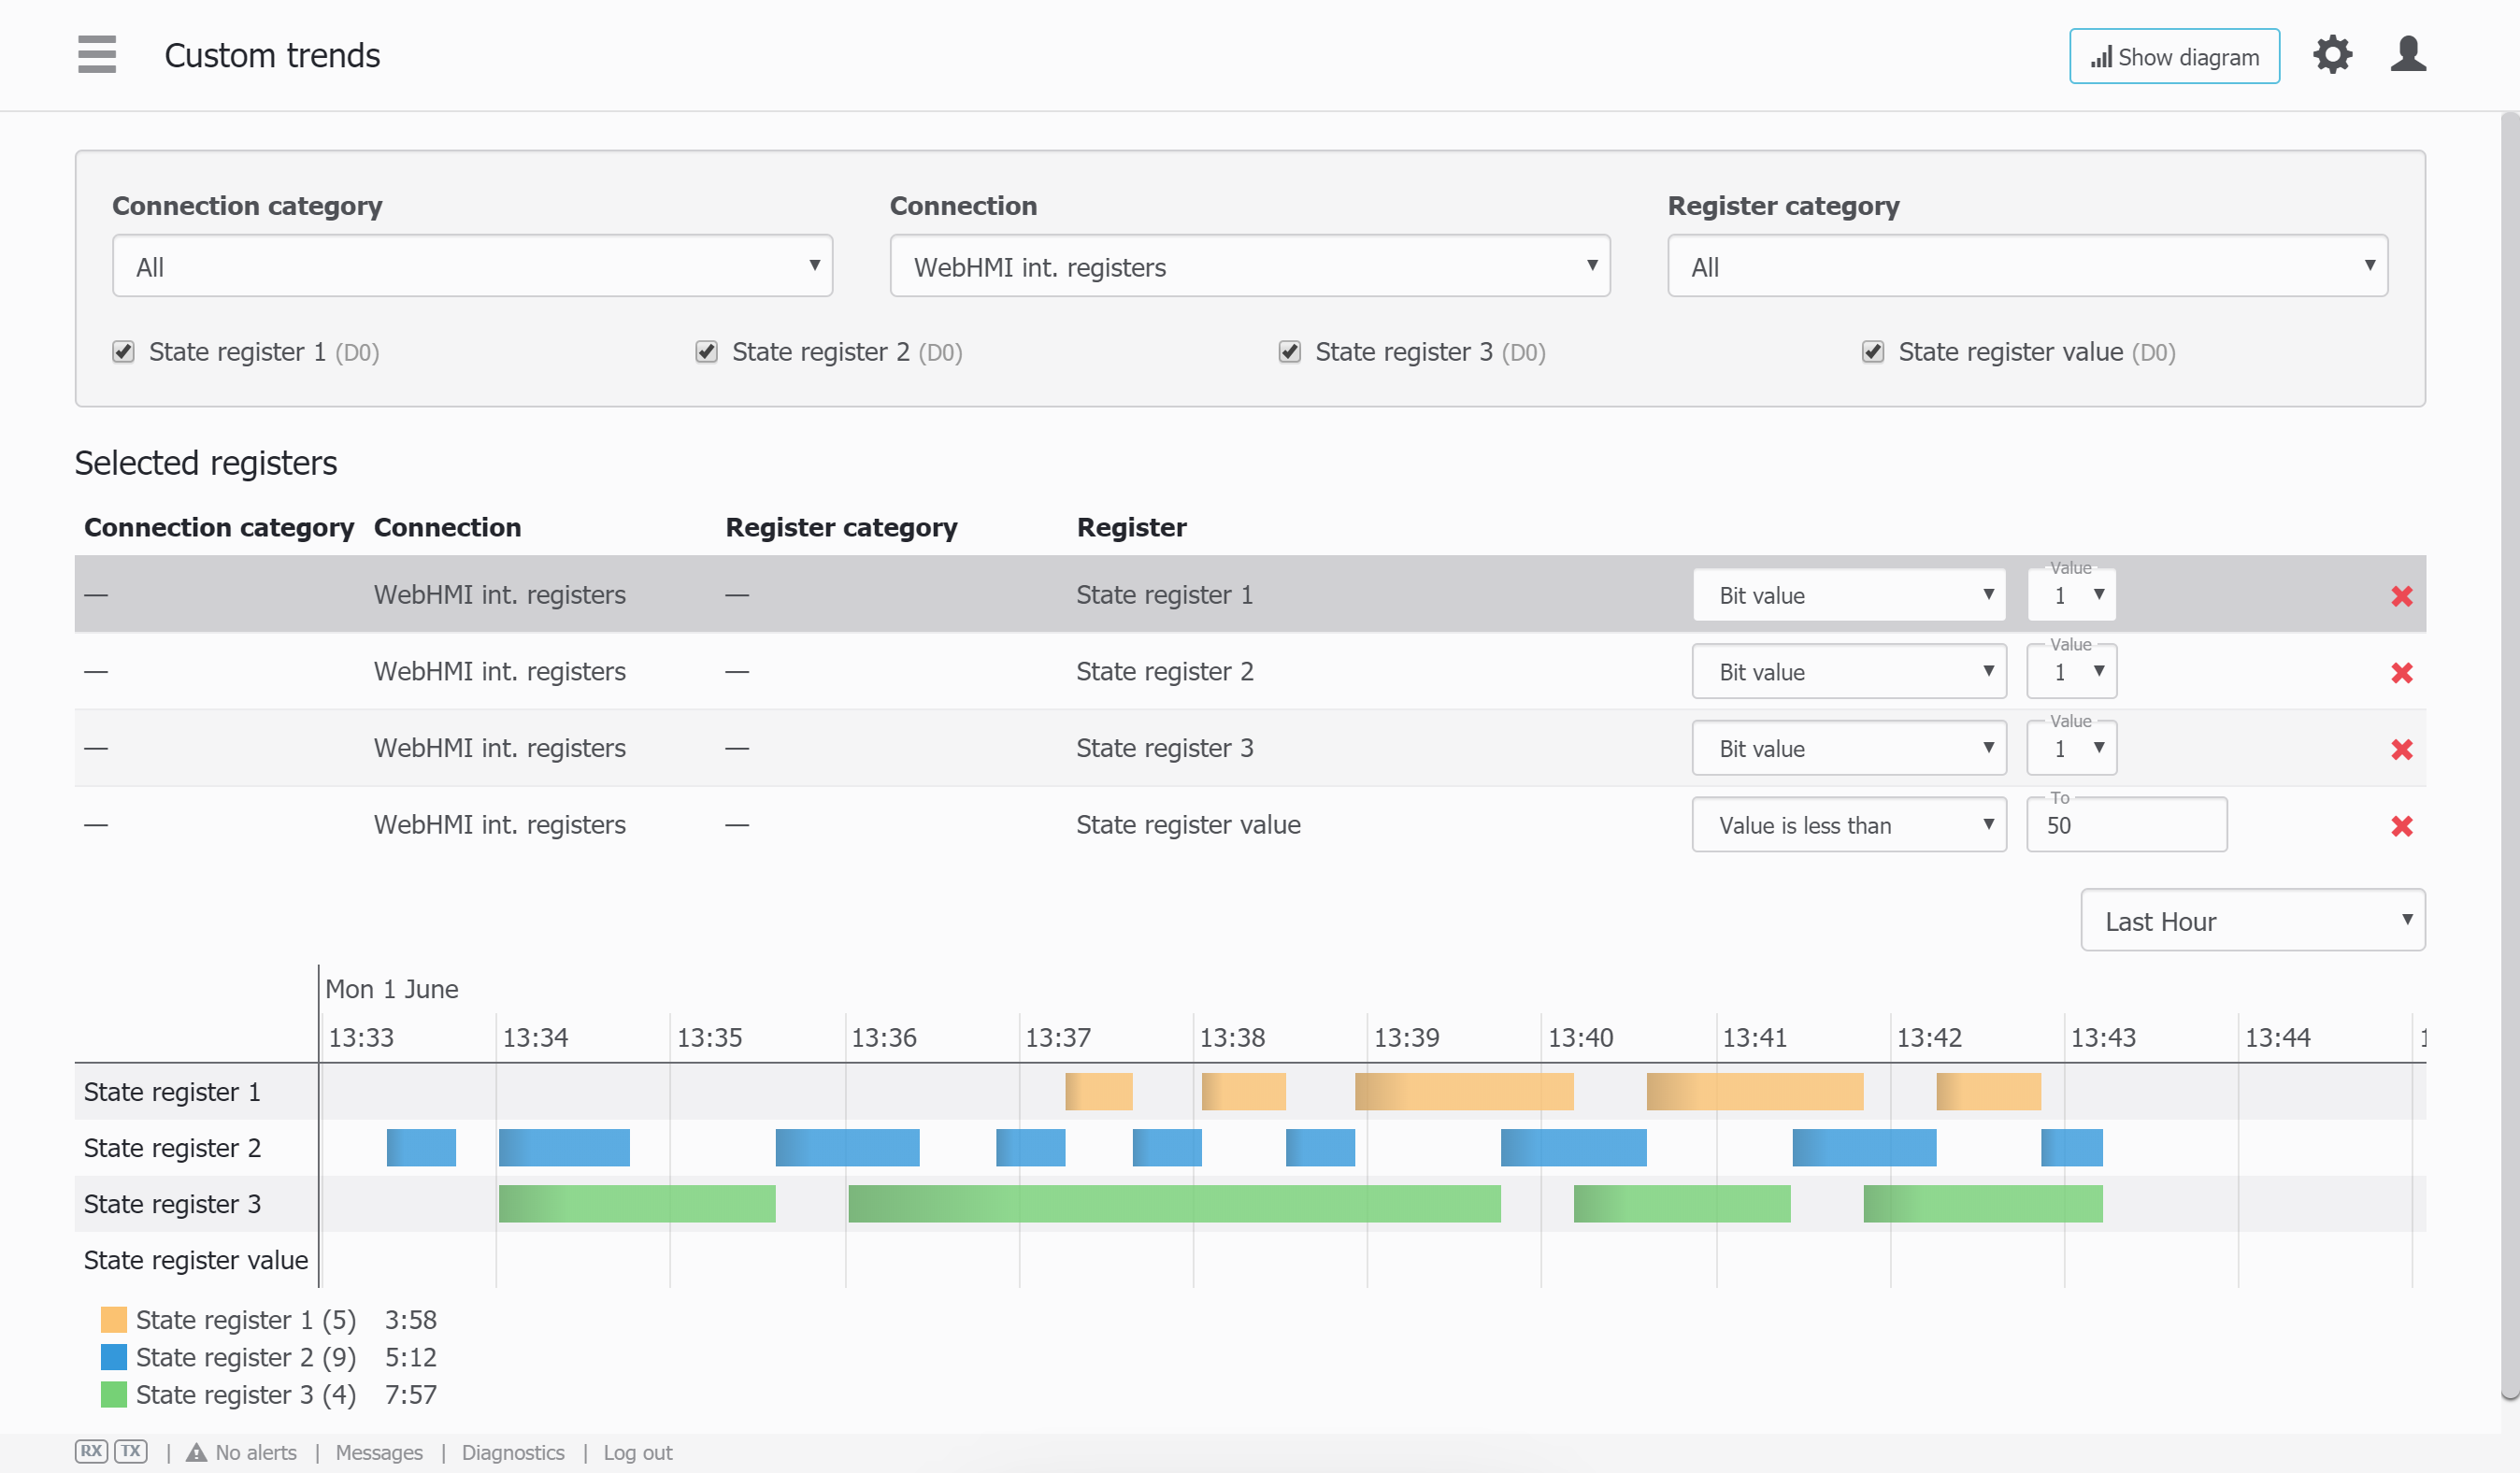
The state is shown as being ON, or colorized, depening on the register values:
- for bit type registers: 0 or 1
- for other type registers:
- 0 or 1 for specific bit #
- value is equal / not equal to, in range / not in range, greater / less than
The legend below the diagram shows registers' title, id, total state ON duration on in the current diagram view.
Meters readings
Starting from 4.0.7164 there is a meters log analytic on the device, without data to Level2 upload.
Resource register's data can be represented in a custom analytics way, which are also available in Analytics menu (since fw 4.0.7164). The registers for this kind of analytics must have 'resource meter' property set.
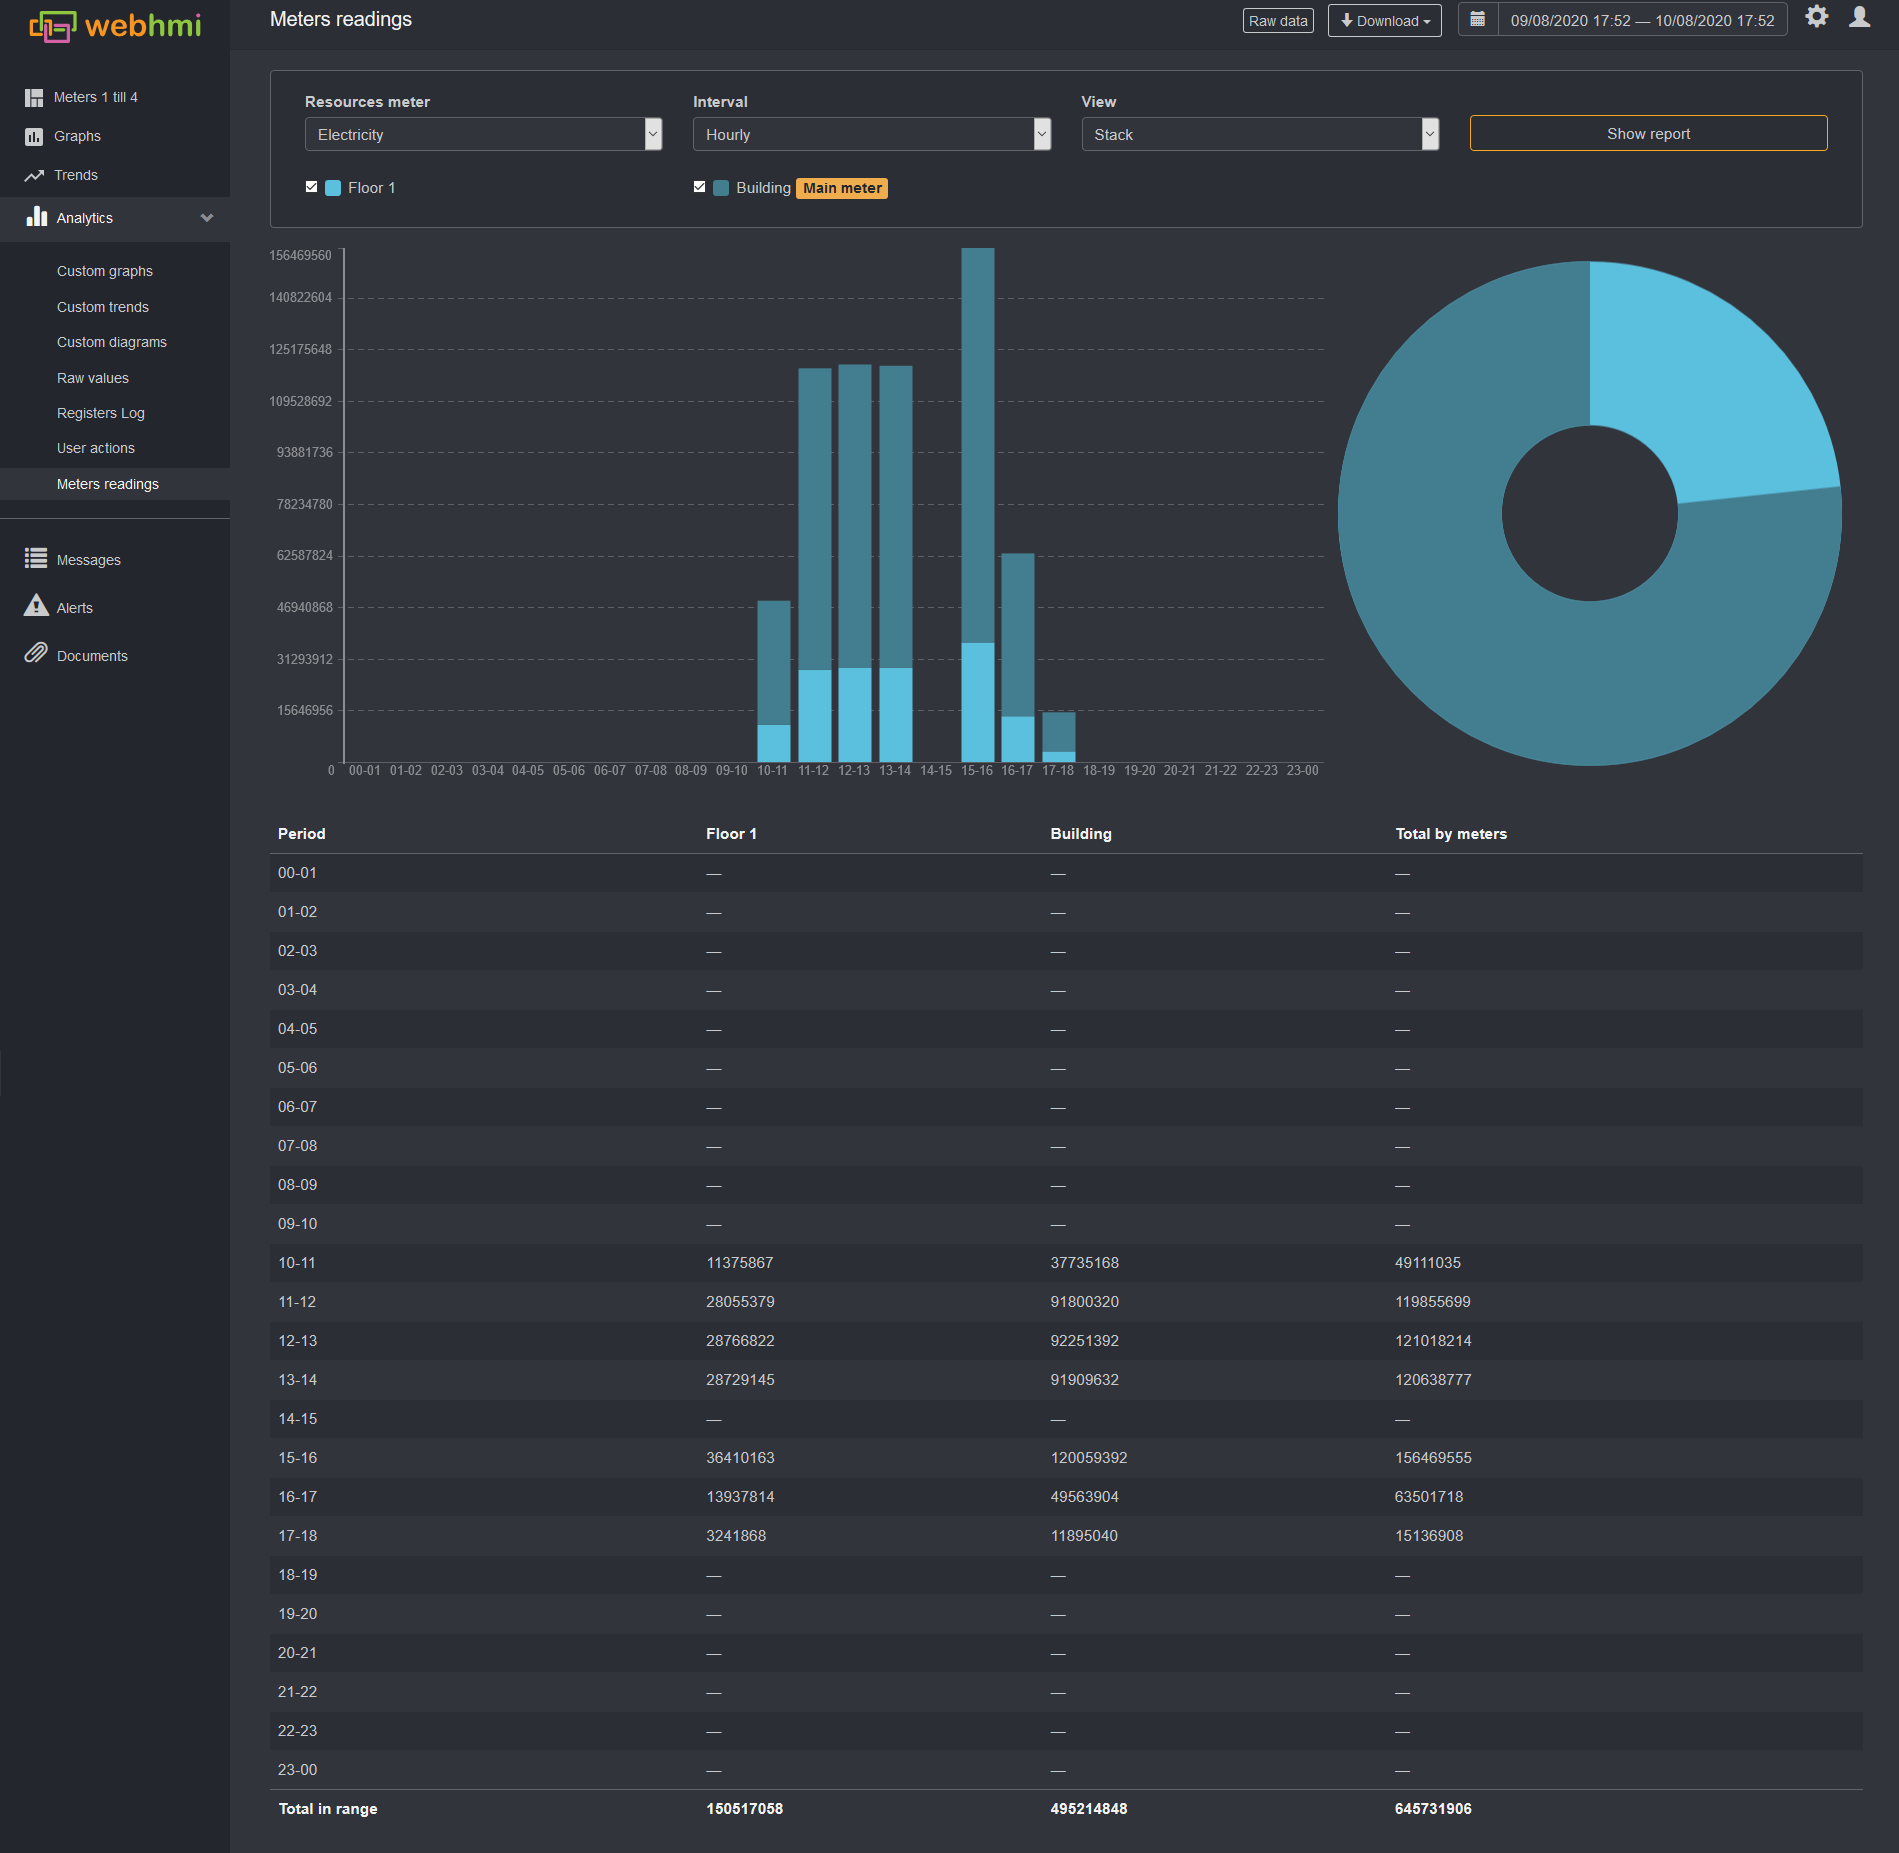
Unlike level2 resource meters and consumption analysis, there is no comparison in monetary terms, to be able compare different types of resources.
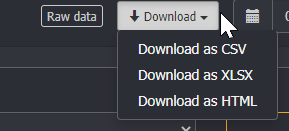
Although, there is an option to download report as file to PC in a various format to choose from, such as .XLSX, .CSV or .HTML.
Important update info on the Custom Graph/Trends/Gantt
As of 4.0.7367 firmware, there is a feature of custom color for the tags chosen:
Custom graphs and charts are a handy analytics tool. Previously, colors for values were inherited from register properties. Now these colors can be set directly during the creation of a graph or chart.